Fig. 5
Download original image
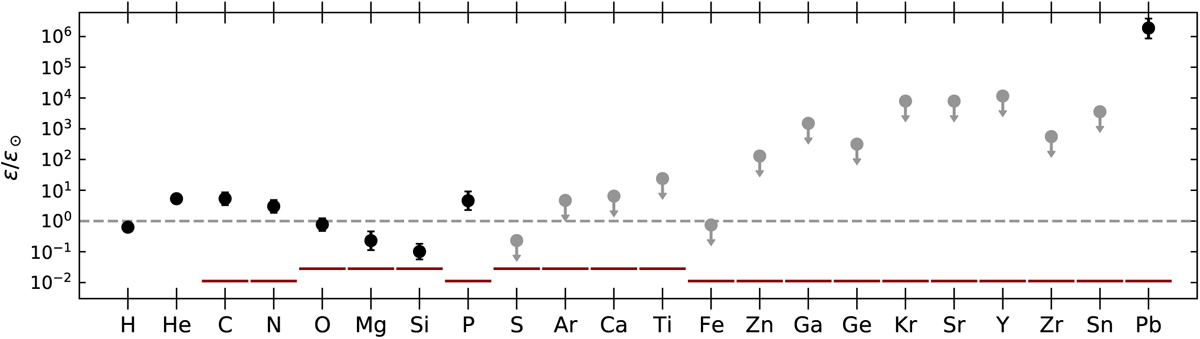
Photospheric abundances for EC 22536–5304 A relative to solar values from Asplund et al. (2009). Abundance measurements are shown as black dots, while upper limits are marked with grey arrows. Solid red lines show the corresponding metal abundances adopted in our model for EC 22536–5304 B, as given by the best-fit [Fe/H] and [α∕Fe ]. The solar reference is indicated by the dashed grey line.
Current usage metrics show cumulative count of Article Views (full-text article views including HTML views, PDF and ePub downloads, according to the available data) and Abstracts Views on Vision4Press platform.
Data correspond to usage on the plateform after 2015. The current usage metrics is available 48-96 hours after online publication and is updated daily on week days.
Initial download of the metrics may take a while.