Free Access
Fig. 3
Download original image
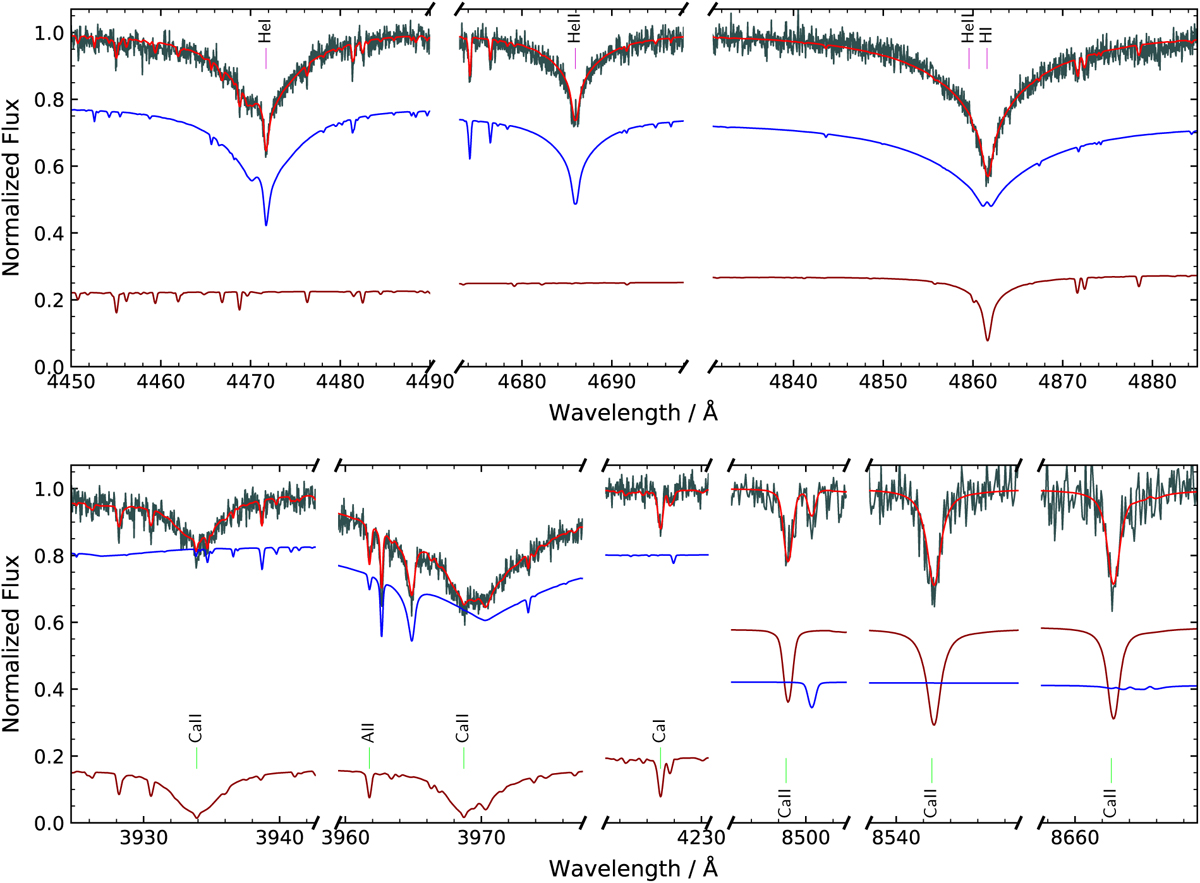
Top: Examples of prominent helium and hydrogen lines in an individual UVES spectrum of EC 22536–5304 (grey). The combined model spectrum (red) is the sum of the contributions of the sdOB (blue) and F-type star (dark red). Bottom: similarly, the strongest calcium lines in blue and red UVES spectra.
Current usage metrics show cumulative count of Article Views (full-text article views including HTML views, PDF and ePub downloads, according to the available data) and Abstracts Views on Vision4Press platform.
Data correspond to usage on the plateform after 2015. The current usage metrics is available 48-96 hours after online publication and is updated daily on week days.
Initial download of the metrics may take a while.