Fig. 1
Download original image
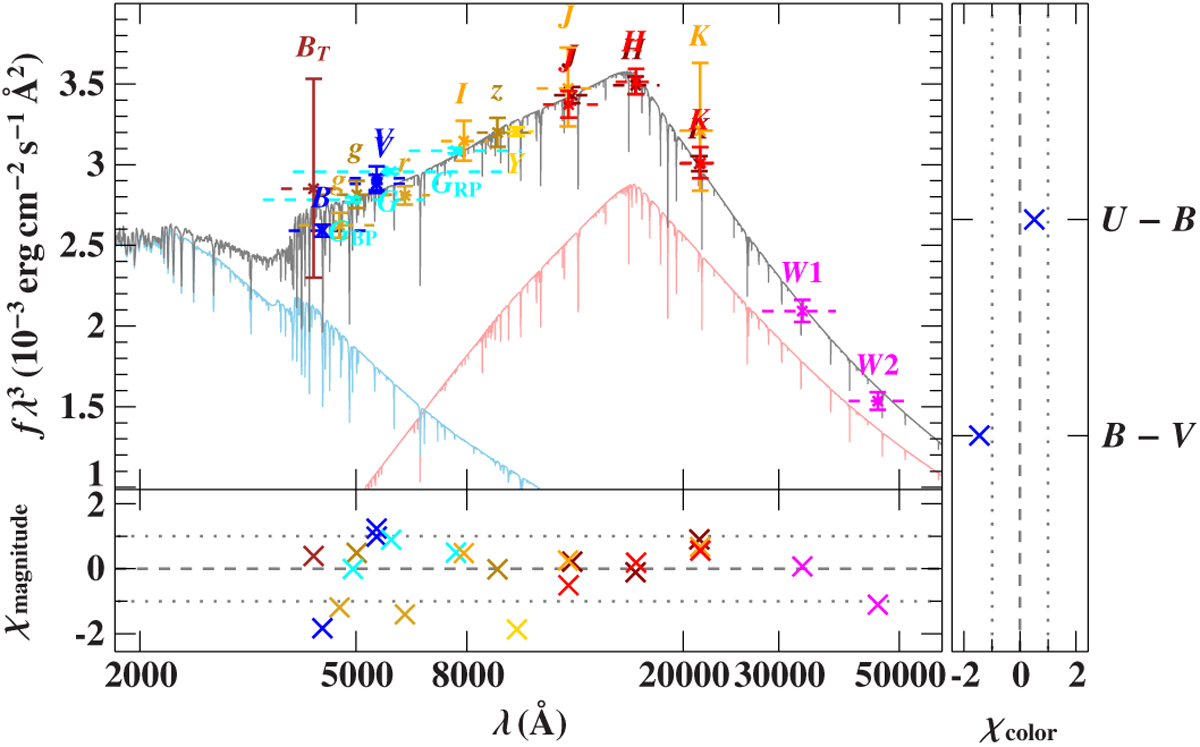
Photometric fit for EC 22536–5304. Filter-averaged fluxes are shown as coloured data points that were converted from observed magnitudes. Filter widths are indicated by dashed horizontal lines. The grey line visualises the combined model spectrum while individual contributions are shown in blue (A) and red (B). The residual panels on the bottom andright side respectively show the differences between synthetic and observed magnitudes and colours. The following colour codes are used to identify the photometric systems: Tycho (brown,Høg et al. 2000), Johnson-Cousins (blue,Henden et al. 2015; Kilkenny et al. 2016), SDSS (yellow, Henden et al. 2015), SkyMapper (dark yellow, Wolf et al. 2018), Gaia (cyan, Riello et al. 2021), DENIS (orange, DENIS Consortium 2005), DES (bright yellow, Abbott et al. 2018), VISTA (dark red, McMahon et al. 2013), 2MASS (bright red, Cutri et al. 2003), and WISE (magenta, Cutri et al. 2021).
Current usage metrics show cumulative count of Article Views (full-text article views including HTML views, PDF and ePub downloads, according to the available data) and Abstracts Views on Vision4Press platform.
Data correspond to usage on the plateform after 2015. The current usage metrics is available 48-96 hours after online publication and is updated daily on week days.
Initial download of the metrics may take a while.