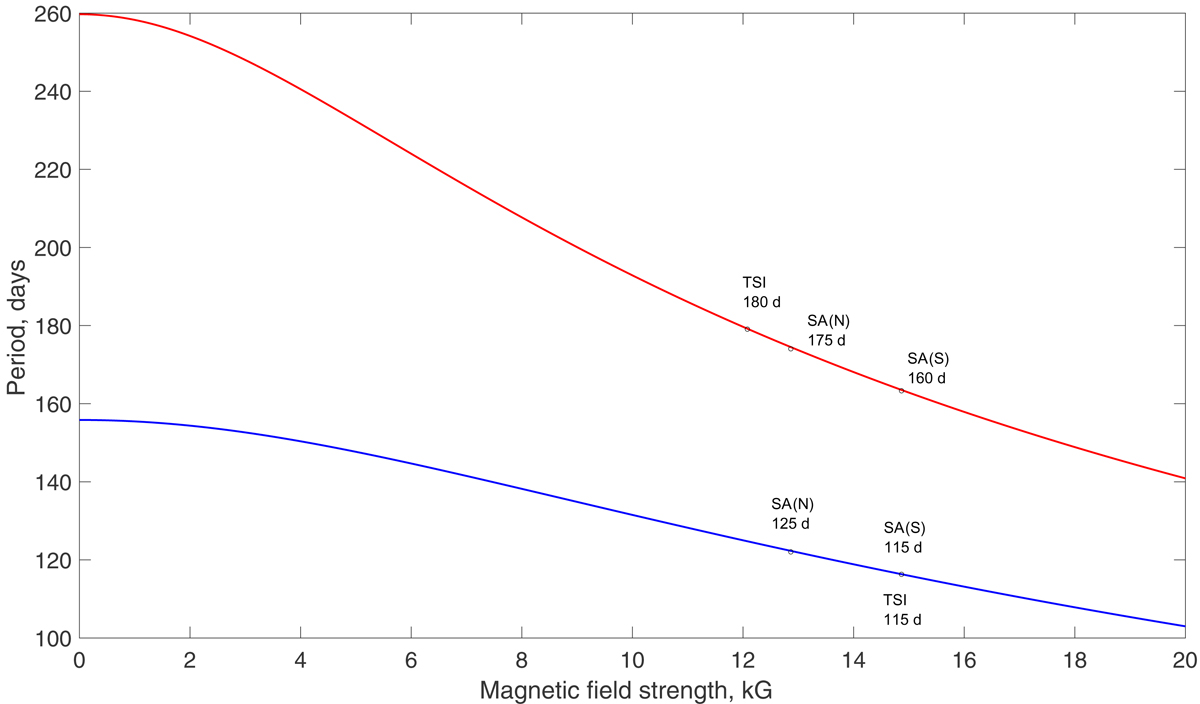
Fig. 6.
Download original image
Period versus dynamo magnetic field strength of the magneto-Rossby wave m = 1 spherical harmonics with n = 4 (red curve) and n = 3 (blue curve) plotted according to Eq. (43) from Gachechiladze et al. (2019). The equatorial angular velocity and plasma density in the dynamo layer are assumed to be Ω0 = 2.8 × 10⁻⁶ s−1 and ρ = 0.2 g cm−3, respectively. The observed periods in different data sets of the cycle 23 are marked by dots on the curves.
Current usage metrics show cumulative count of Article Views (full-text article views including HTML views, PDF and ePub downloads, according to the available data) and Abstracts Views on Vision4Press platform.
Data correspond to usage on the plateform after 2015. The current usage metrics is available 48-96 hours after online publication and is updated daily on week days.
Initial download of the metrics may take a while.