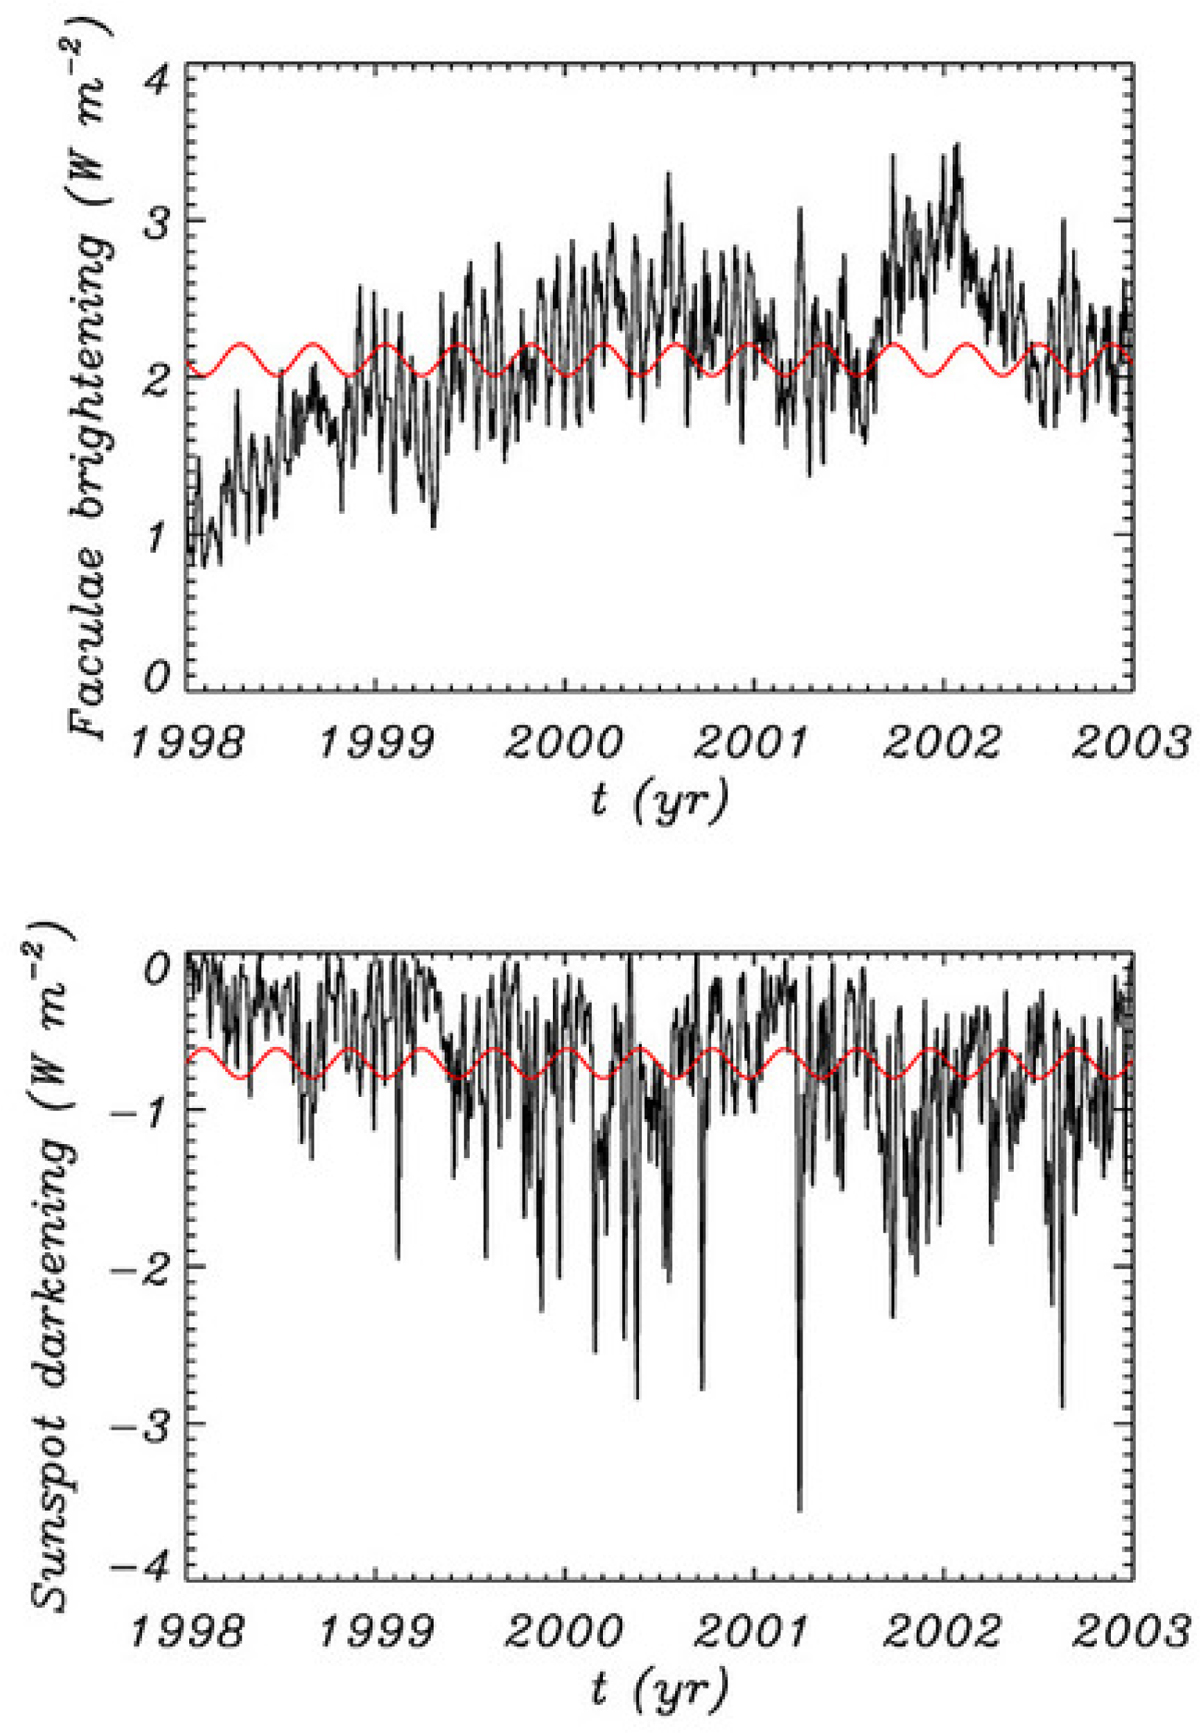
Fig. 5.
Download original image
Fitting of sinusoidal function with the period of 140 days (red curves) defined by Eq. (1) to the raw data of faculae brightening (upper panel) and sunspot darkening (lower panel). We note that the sinusoidal fit here is only used to show the phase relation of the two oscillations and does not intend to model the time series.
Current usage metrics show cumulative count of Article Views (full-text article views including HTML views, PDF and ePub downloads, according to the available data) and Abstracts Views on Vision4Press platform.
Data correspond to usage on the plateform after 2015. The current usage metrics is available 48-96 hours after online publication and is updated daily on week days.
Initial download of the metrics may take a while.