Free Access
Fig. 2.
Download original image
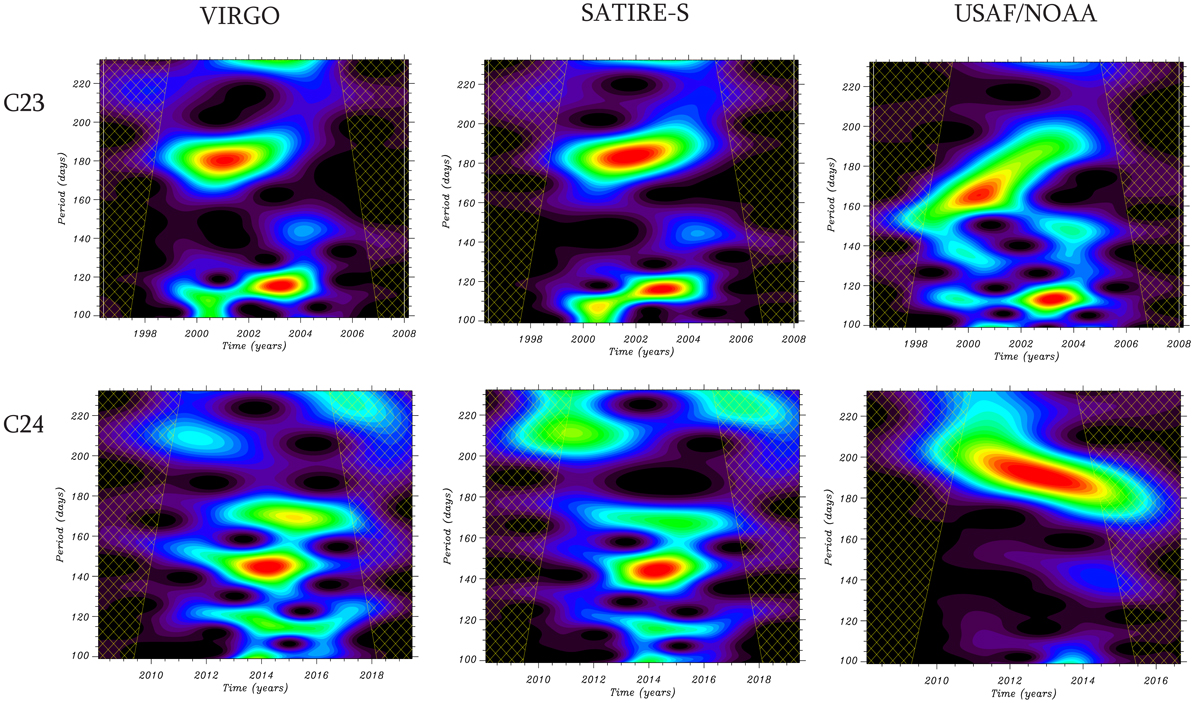
Morlet wavelet analysis in the period range of 100–220 days (Torrence & Compo 1998). Upper and lower panels correspond to the cycle 23 and 24, respectively. Left panels: wavelet spectrum based on VIRGO data. Middle panels: SATIRE data. Right panels: display the USAF/NOAA full disk sunspot area data.
Current usage metrics show cumulative count of Article Views (full-text article views including HTML views, PDF and ePub downloads, according to the available data) and Abstracts Views on Vision4Press platform.
Data correspond to usage on the plateform after 2015. The current usage metrics is available 48-96 hours after online publication and is updated daily on week days.
Initial download of the metrics may take a while.