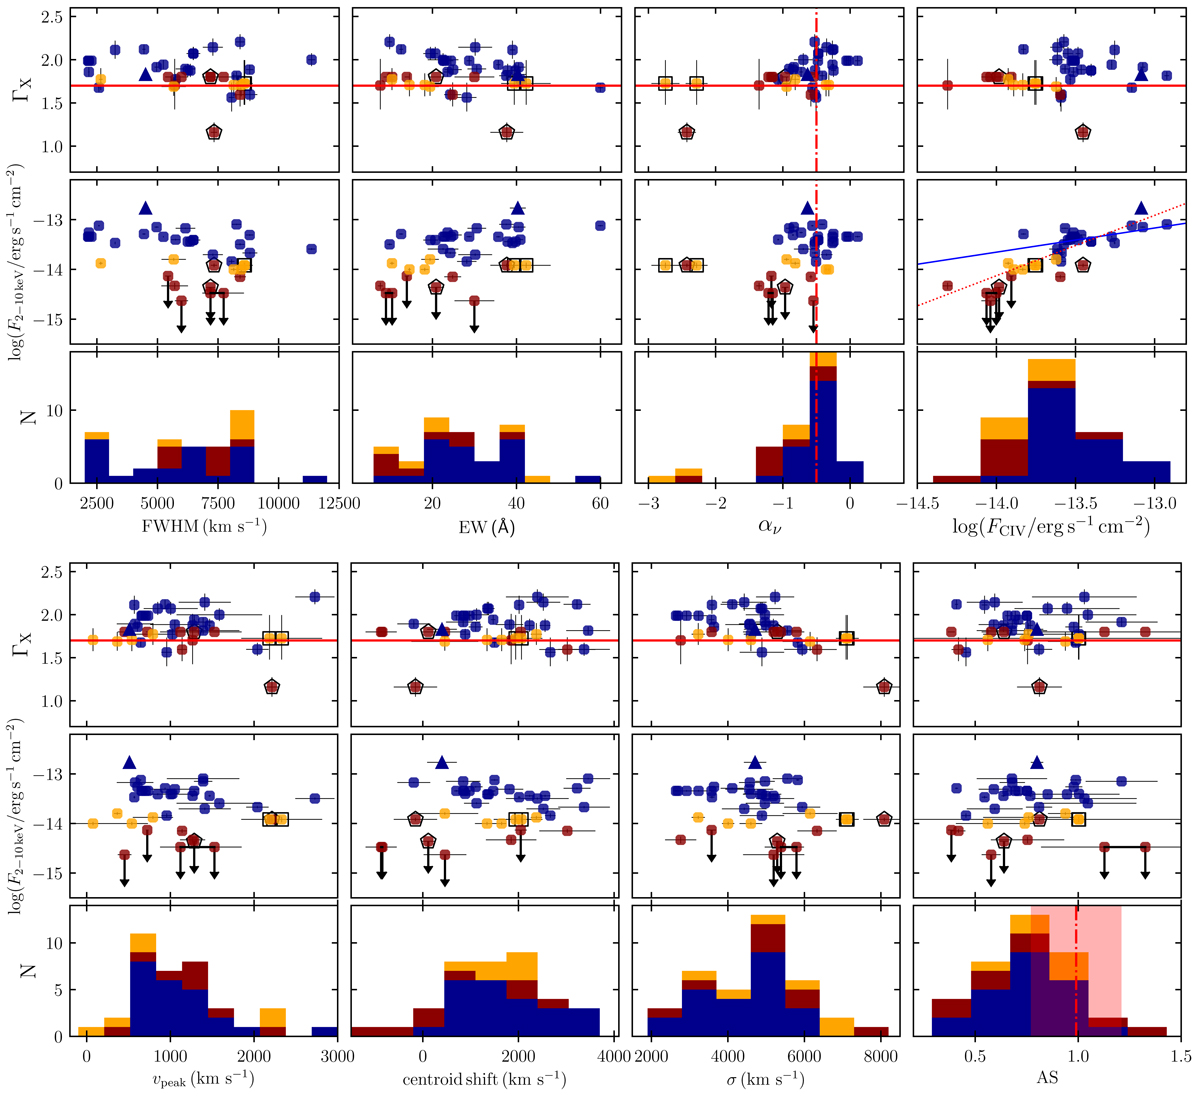
Fig. 8.

Download original image
X-ray versus C IV emission-line properties for the 38 SDSS spectra. In the first two rows from the top, the continuum photon index and the 2−10 keV flux (in erg s−1 cm−2) are plotted against the C IV FWHM (in km s−1), EW (in Å), the UV continuum slope (αν), and the total C IV emission-line flux (in erg s−1 cm−2), the distributions of which are shown in the third row. The solid red line at ΓX = 1.7 represents the minimum value adopted by RL19 to select the clean quasar sample for cosmology. The dot-dashed red line in the αν panel marks an UV continuum slope of −0.5, typical for z > 2 quasars (Lusso et al. 2015). Only F2 − 10 keV shows a significant correlation with FC IV, where the solid blue and dotted red lines represent the best-fit regression solutions for N and N+W+w sources (radio-bright, BALs, and red quasars are excluded; see Sect. 2.1). In the fourth and fifth rows, ΓX and F2 − 10 keV are plotted as a function of the C IV peak velocity υpeak (with respect to the nominal wavelength), the velocity shift of the line centroid, the velocity dispersion σ, and the asymmetry index (AS). Redward (blueward) asymmetries correspond to AS values > 1 (< 1), where the dot-dashed line marks AS = 1 (as generally found at lower UV luminosity and redshift) and the red shaded area the typical dispersion on this parameter of 0.22 dex.
Current usage metrics show cumulative count of Article Views (full-text article views including HTML views, PDF and ePub downloads, according to the available data) and Abstracts Views on Vision4Press platform.
Data correspond to usage on the plateform after 2015. The current usage metrics is available 48-96 hours after online publication and is updated daily on week days.
Initial download of the metrics may take a while.


