Fig. 7.

Download original image
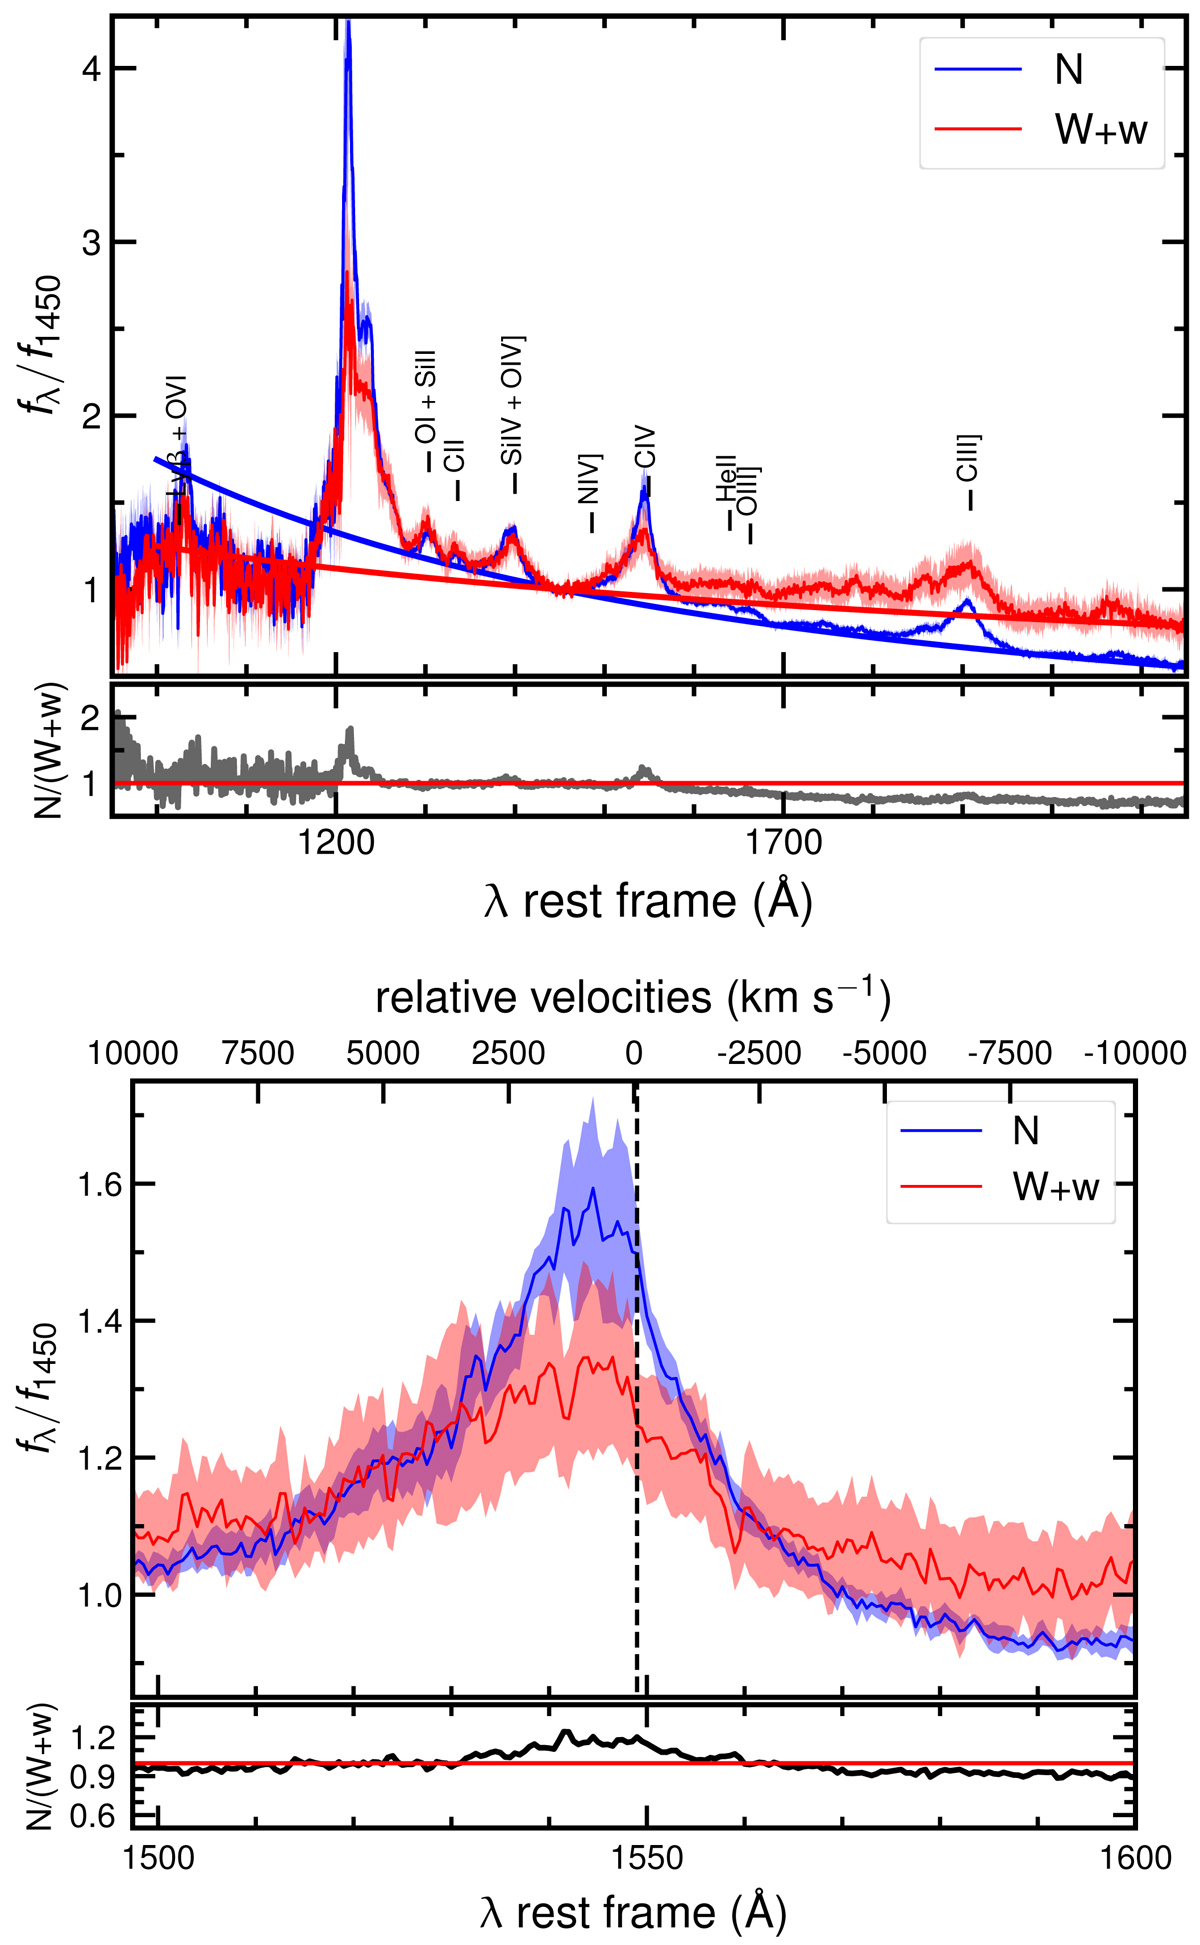
Spectral stacks of the z ≃ 3 quasars. Top panel: mean observed quasar spectra for the X-ray normal (N, blue) and X-ray weak plus X-ray-weak candidates (W+w, red). These composites are estimated from a stack of the SDSS spectra (23 N and 10 W+w spectra), each normalised to unit flux at 1450 Å with uncertainties from bootstrap analysis (shaded area). The UV continuum slopes for the N and W+w composites are shown with the blue and red lines, respectively. Bottom panel: zoom-in of the C IV emissionf line for the N and W+w composites. The velocity shift from the rest-frame transition wavelength (1549 Å) is shown on the top x axis. In both panels, the ratio of the N over the W+w mean spectra is also shown at the bottom with a black line.
Current usage metrics show cumulative count of Article Views (full-text article views including HTML views, PDF and ePub downloads, according to the available data) and Abstracts Views on Vision4Press platform.
Data correspond to usage on the plateform after 2015. The current usage metrics is available 48-96 hours after online publication and is updated daily on week days.
Initial download of the metrics may take a while.


