Fig. 4.

Download original image
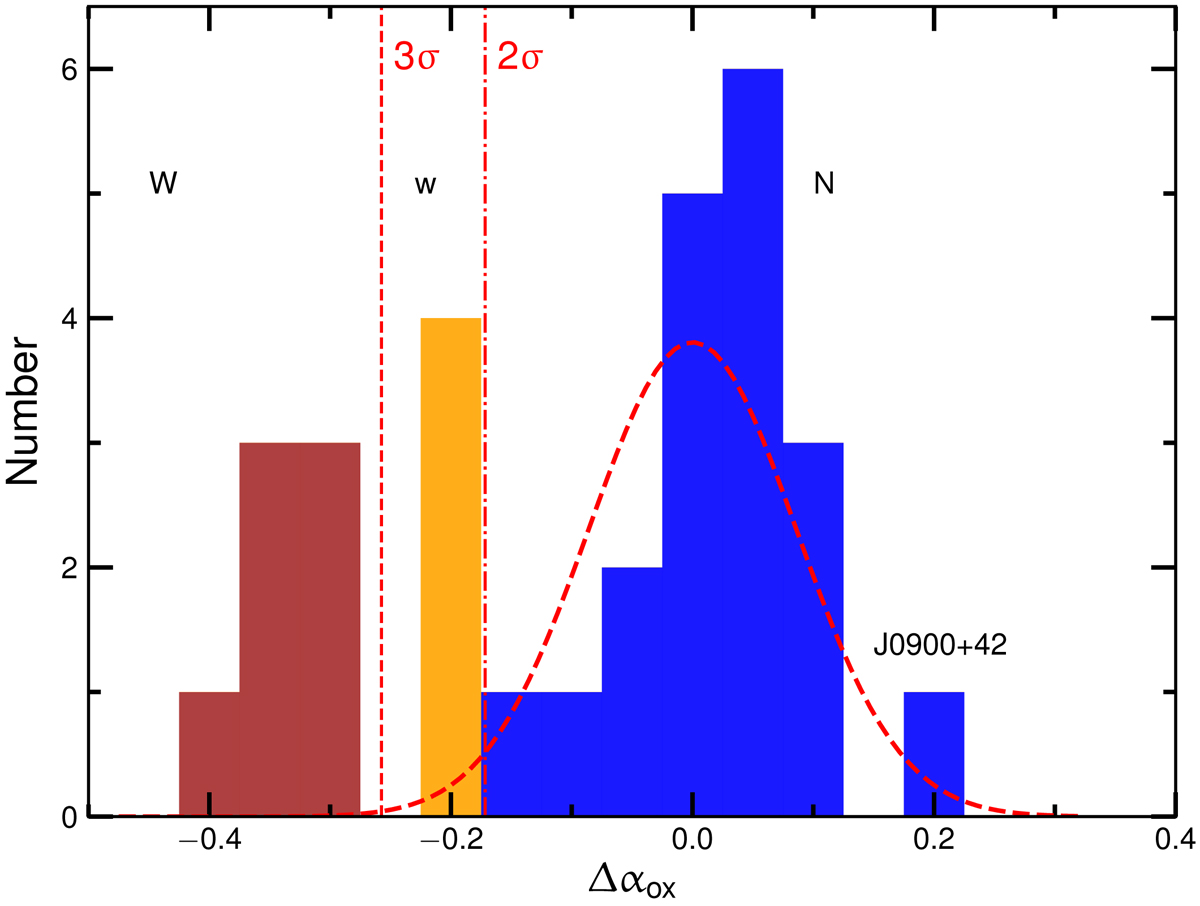
Distribution of Δαox in the z ≃ 3 sample (see Sect. 2.3 for details). The dashed curve is the best fitting normal distribution for the 25 radio-quiet sources with unquestionable X-ray detection (we also neglected the radio-bright quasar J0900+42), where the peak position is forced to be at Δαox = 0. We define as X-ray-weak (W) and X-ray-weak candidates (w) all the sources at more than 3σ (seven objects, brown histogram) and 2σ (four objects, orange histogram) from the peak, respectively. All the other quasars are considered as X-ray normal (N, blue histogram).
Current usage metrics show cumulative count of Article Views (full-text article views including HTML views, PDF and ePub downloads, according to the available data) and Abstracts Views on Vision4Press platform.
Data correspond to usage on the plateform after 2015. The current usage metrics is available 48-96 hours after online publication and is updated daily on week days.
Initial download of the metrics may take a while.


