Fig. 3.

Download original image
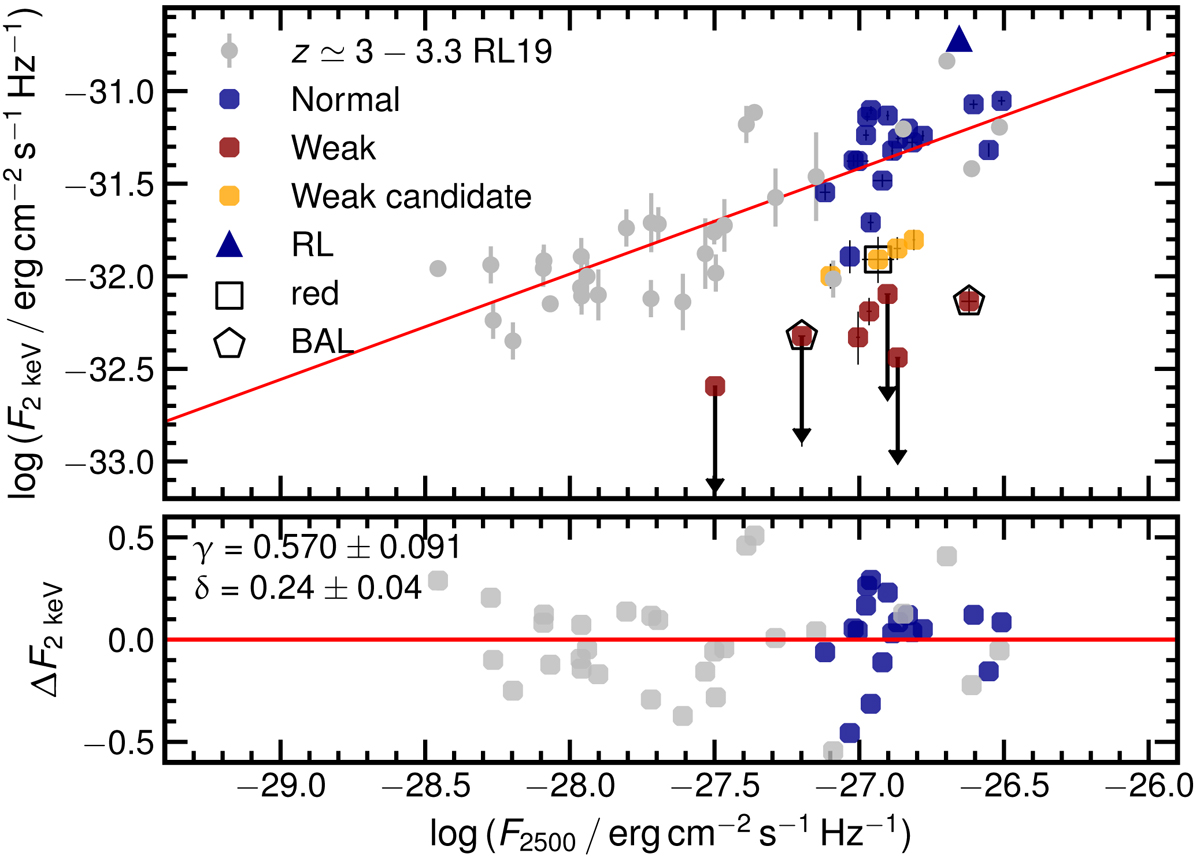
Relation between the rest-frame monochromatic X-ray (2 keV) and UV (2500 Å) fluxes for quasars in the redshift range z = 3.0−3.3. The colour code is the same as that adopted in Fig. 2 for the different sub-samples defined in Sect. 2.3. Grey points represent the other sources in the same redshift range from the cleaned quasar sample of RL19 (30 objects). The red line is the regression best fit for the z = 3.0−3.3 RL19 sources only. Slope and dispersion values are reported with the residuals from the best fit in the bottom panel (from which X-ray weak, in brown, and weak candidates, in orange, are omitted for clarity).
Current usage metrics show cumulative count of Article Views (full-text article views including HTML views, PDF and ePub downloads, according to the available data) and Abstracts Views on Vision4Press platform.
Data correspond to usage on the plateform after 2015. The current usage metrics is available 48-96 hours after online publication and is updated daily on week days.
Initial download of the metrics may take a while.


