Fig. A.1.

Download original image
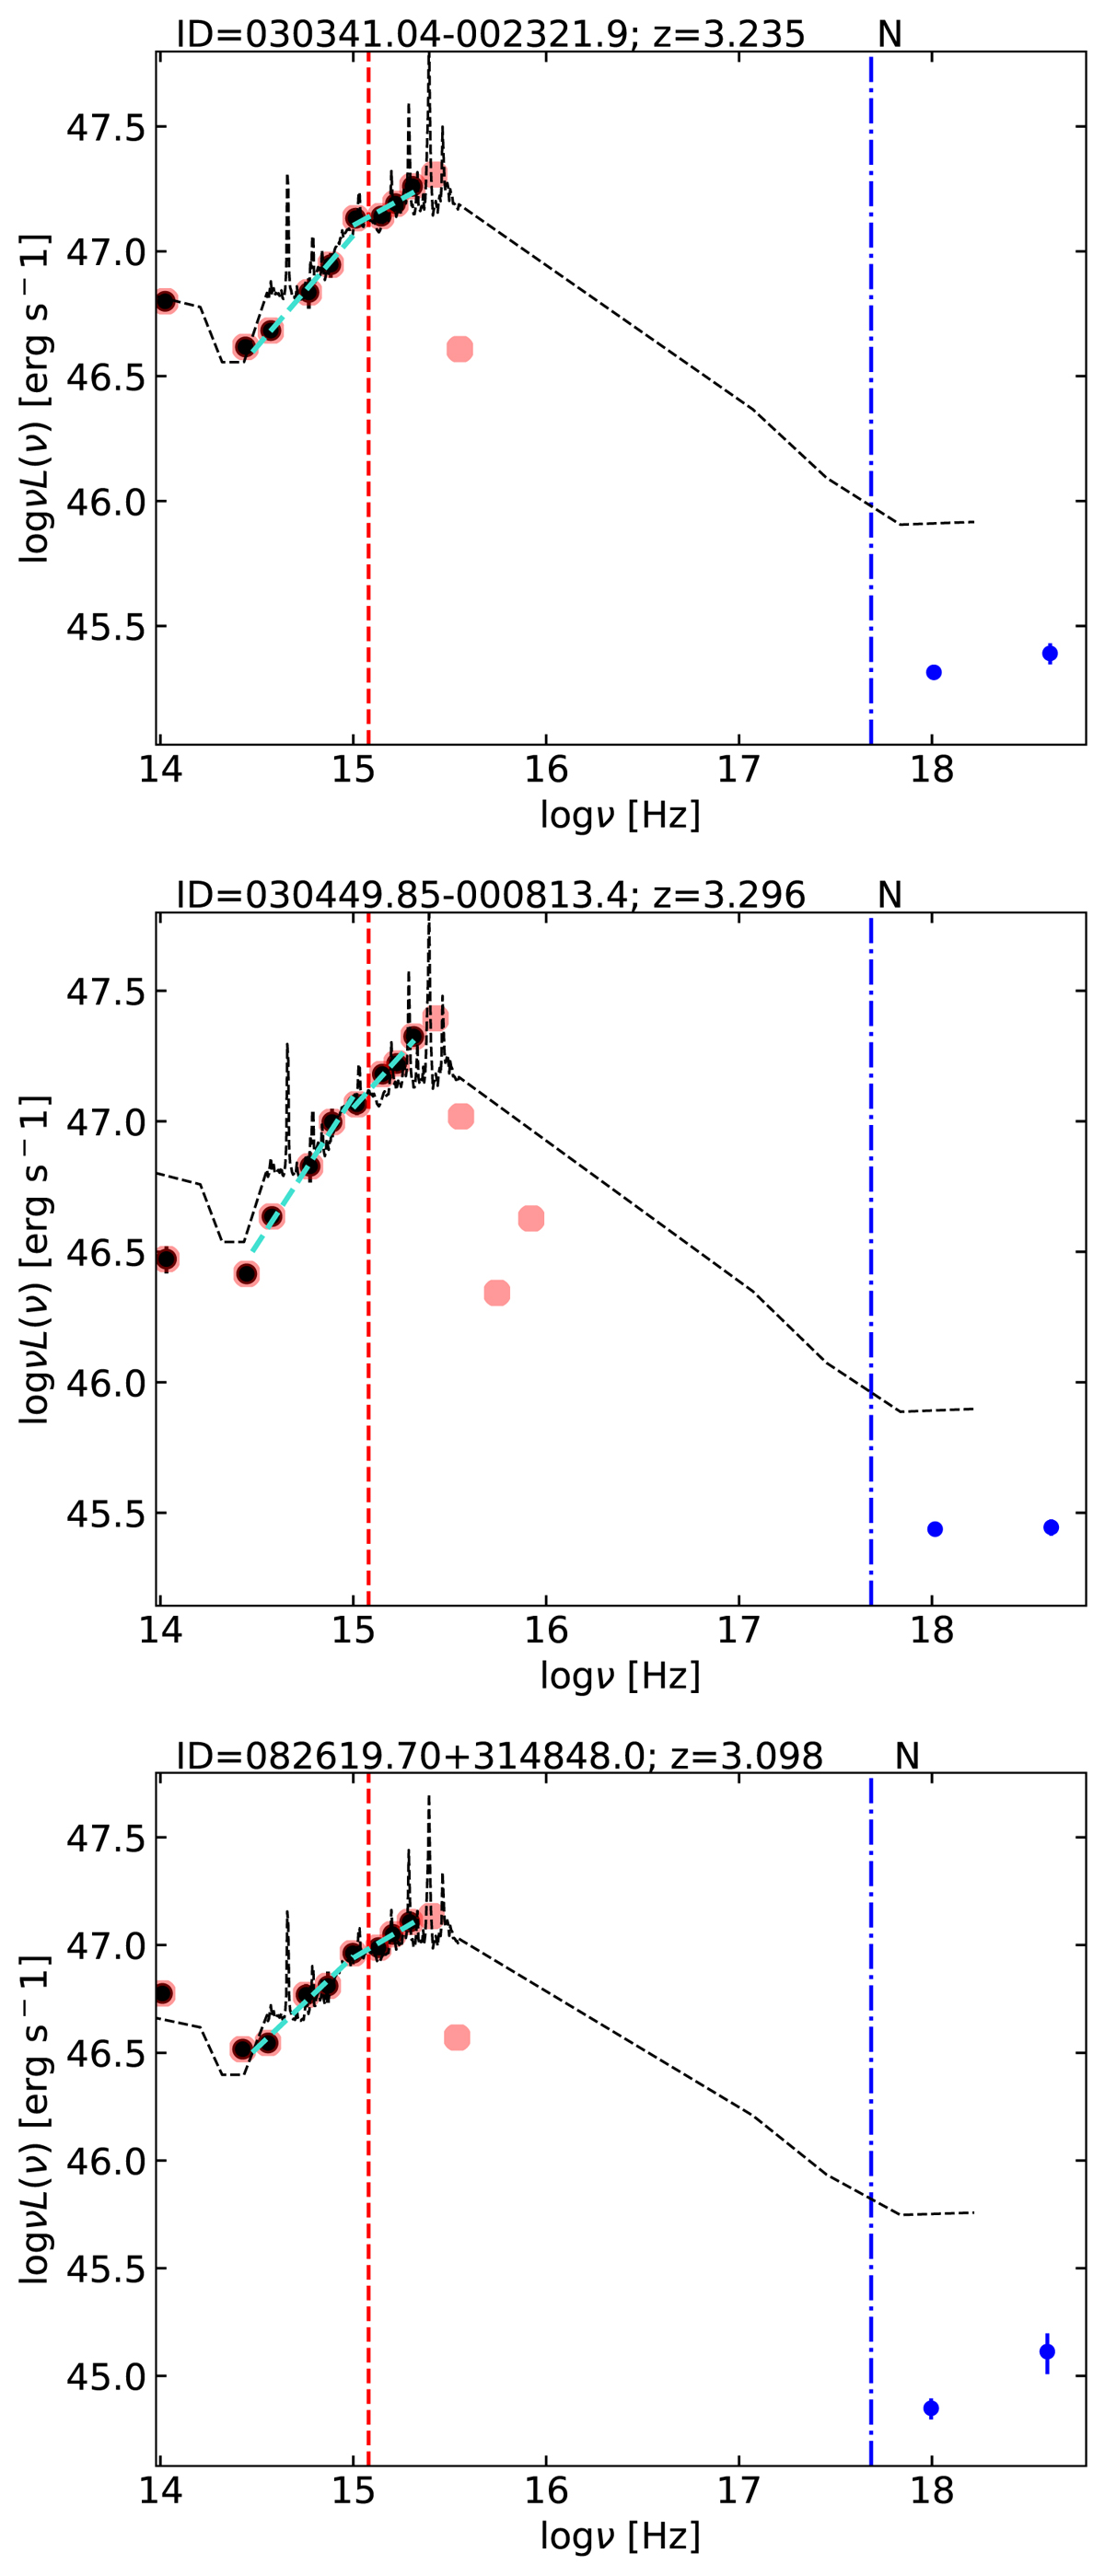
SEDs of the z ≃ 3 quasars in the rest-frame ν − νL(ν) logarithmic plane. The red circles mark all the available photometry from the SDSS-DR14 catalogue, but only the ones highlighted with black circles were used to construct the SEDs. The dashed cyan lines represent the slopes Γ1 and Γ2 in the 0.3−1 μm and 1450−3000 Å range (rest frame), respectively. The composite SDSS radio-quiet quasar spectrum from Shang et al. (2011) is also shown for reference with the dashed black line, normalised at 2500 Å (indicated by the dashed red line). We included the X-ray data with blue points for the soft and the hard band. The dot-dashed blue line locates the 2 keV point.
Current usage metrics show cumulative count of Article Views (full-text article views including HTML views, PDF and ePub downloads, according to the available data) and Abstracts Views on Vision4Press platform.
Data correspond to usage on the plateform after 2015. The current usage metrics is available 48-96 hours after online publication and is updated daily on week days.
Initial download of the metrics may take a while.


