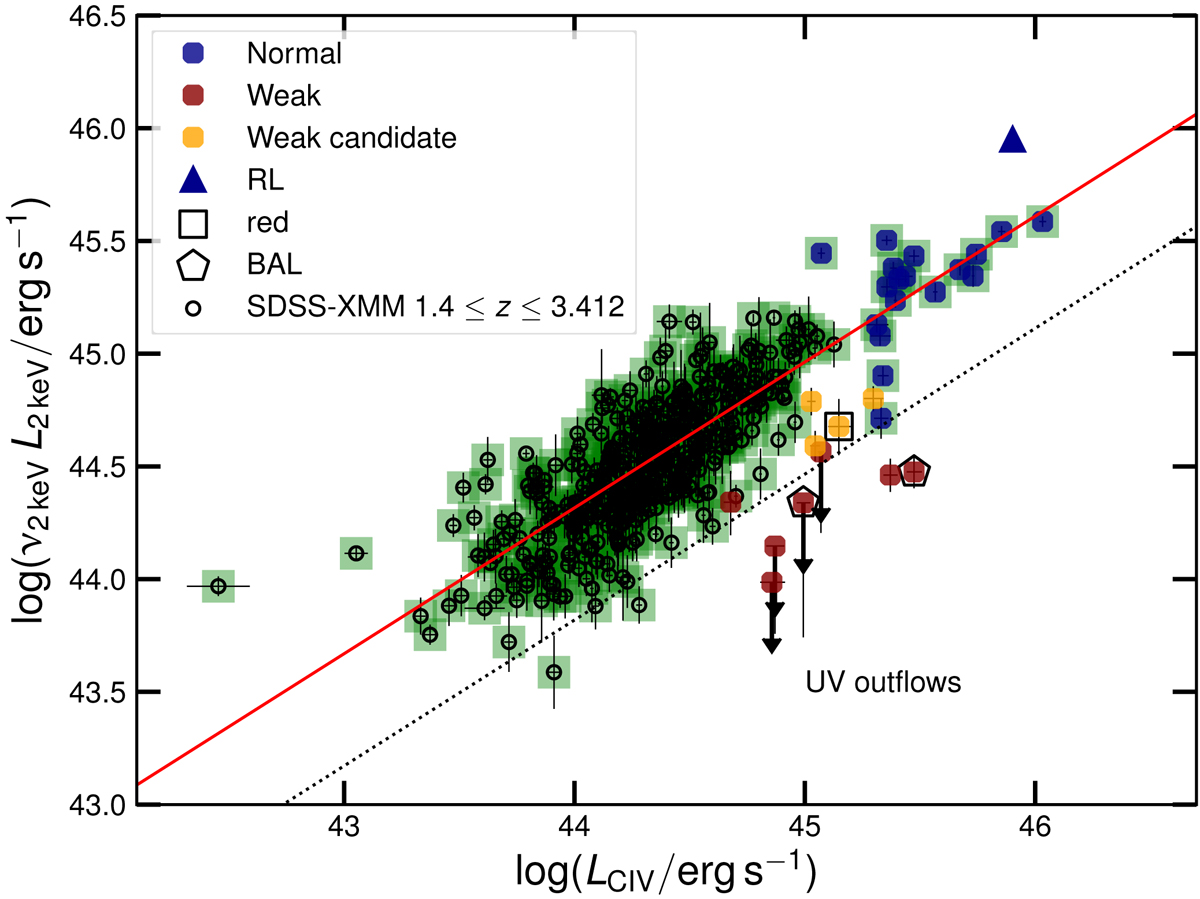
Fig. 14.

Download original image
X-ray luminosity at 2 keV as a function of the total integrated C IV line luminosity. Green squares highlight the sources used in the MCMC regression line analysis. Black circles describe a lower-redshift and lower-luminosity SDSS-XMM sample with a robust measurement of the integrated C IV line luminosity (Signorini et al., in prep.). The dotted line represents three times the intrinsic dispersion on the relation, ∼0.5 dex.
Current usage metrics show cumulative count of Article Views (full-text article views including HTML views, PDF and ePub downloads, according to the available data) and Abstracts Views on Vision4Press platform.
Data correspond to usage on the plateform after 2015. The current usage metrics is available 48-96 hours after online publication and is updated daily on week days.
Initial download of the metrics may take a while.


