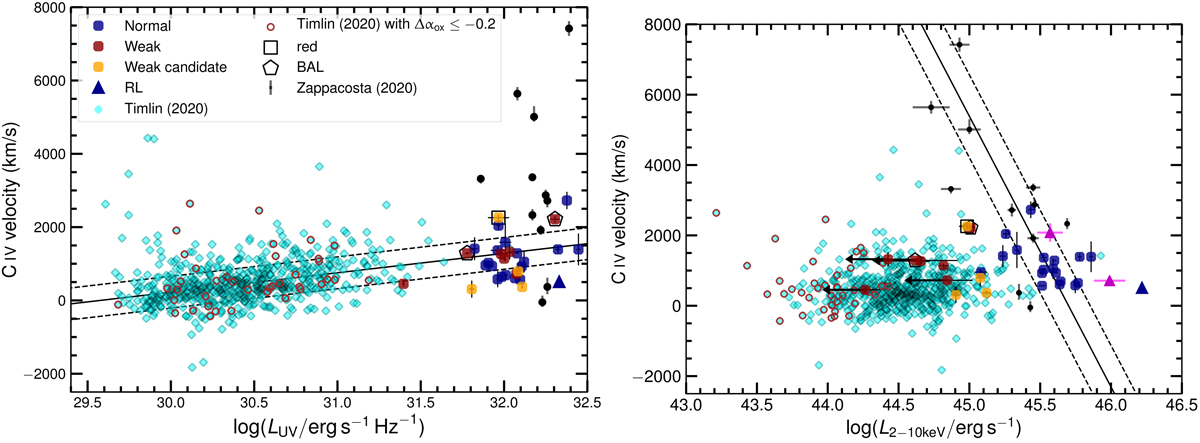
Fig. 13.

Download original image
LUV (left) and L2 − 10 keV (right), as a function of the rest frame C IV peak velocity shift for the z ≃ 3, T20/C IV, and WISSH (Zappacosta et al. 2020) samples (we excluded two quasars that overlap with our z ≃ 3 sample), and five additional z ≃ 3.2 − 3.7 quasars with available υpeak (published by Coatman et al. 2017, magenta triangles, we neglected three overlaps with our z ≃ 3 sample). The solid line in the left panel is the C IVυpeak − LUV best-fit relation by T20, whilst the one in the right panel is the L2 − 10 keV–C IVυpeak best-fit relation reported by Zappacosta et al. (2020, see their Table 1). X-ray-weak quasars in T20 (Δαox ≤ −0.2) are marked with brown open circles.
Current usage metrics show cumulative count of Article Views (full-text article views including HTML views, PDF and ePub downloads, according to the available data) and Abstracts Views on Vision4Press platform.
Data correspond to usage on the plateform after 2015. The current usage metrics is available 48-96 hours after online publication and is updated daily on week days.
Initial download of the metrics may take a while.


