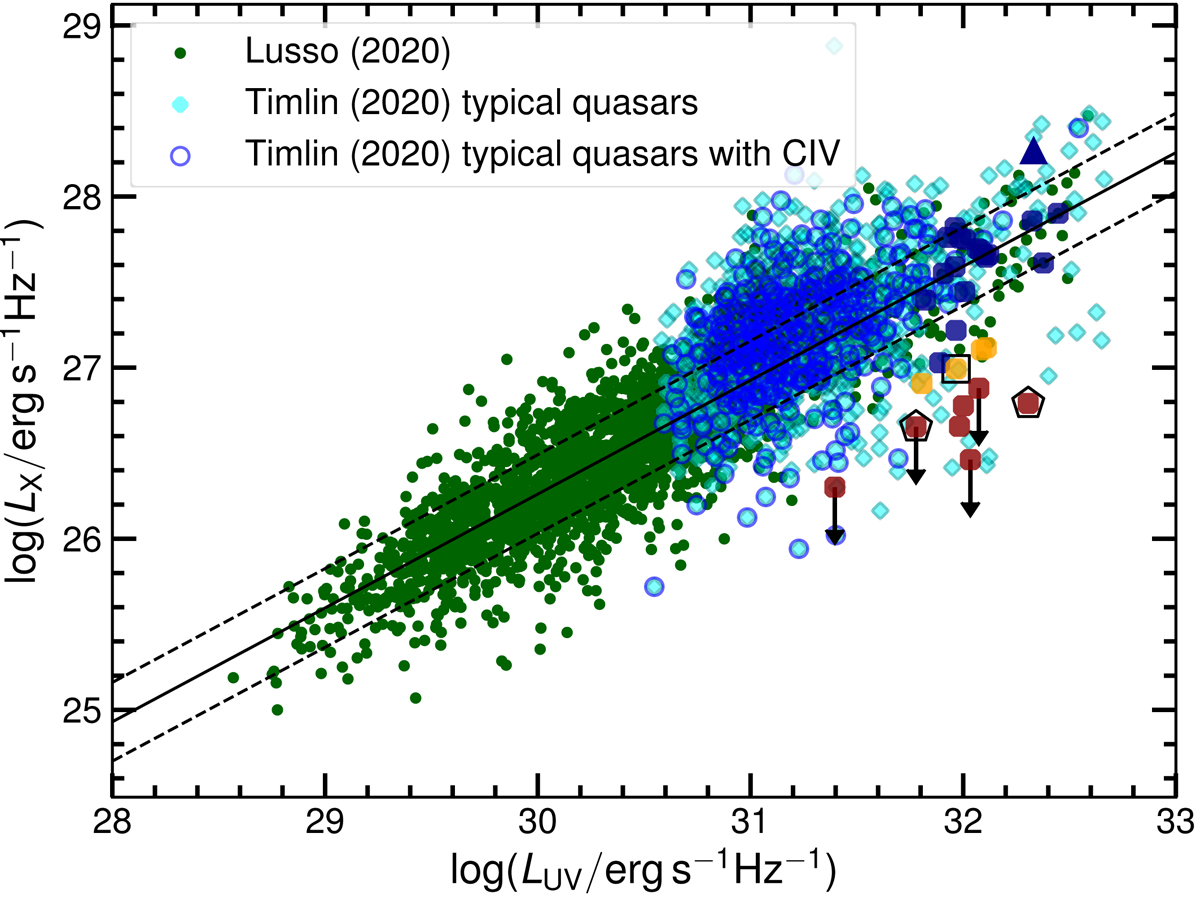
Fig. 10.

Download original image
Rest-frame monochromatic luminosities log LX against log LUV for the 30 quasars in our z ≃ 3 sample. The colour coding is the same as in the previous figures. The green dots represent the sample of ∼2400 quasars from L20, with the relative regression line. The dashed lines trace the 1σ dispersion, 0.23 dex. We overplotted the sample of typical quasars from Timlin et al. (2020), where sources with an available C IV measurement are highlighted with a blue circle.
Current usage metrics show cumulative count of Article Views (full-text article views including HTML views, PDF and ePub downloads, according to the available data) and Abstracts Views on Vision4Press platform.
Data correspond to usage on the plateform after 2015. The current usage metrics is available 48-96 hours after online publication and is updated daily on week days.
Initial download of the metrics may take a while.


