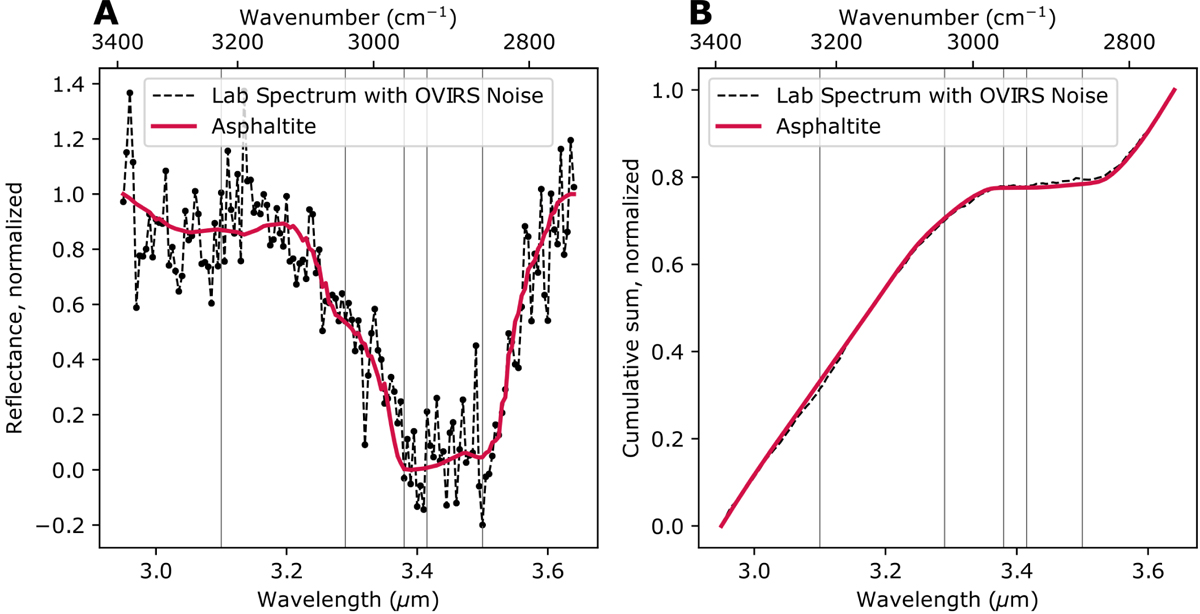
Fig. A.4.
Download original image
Example of the two fitting methods developed in two previous studies (Kaplan et al. 2020; Ferrone et al. 2021): (a) linear least-squares fitting of normalized data and (b) a Kolmogorov-Smirnov fitting method, in which we search for the maximum distance between the two curves. The black curves are laboratory data with noise added to simulate OVIRS noise, and the red curves are laboratory data at their original S/N. Vertical lines at 3.10, 3.275, 3.38, 3.42, and 3.50 μm indicate positions of possible absorption features.
Current usage metrics show cumulative count of Article Views (full-text article views including HTML views, PDF and ePub downloads, according to the available data) and Abstracts Views on Vision4Press platform.
Data correspond to usage on the plateform after 2015. The current usage metrics is available 48-96 hours after online publication and is updated daily on week days.
Initial download of the metrics may take a while.