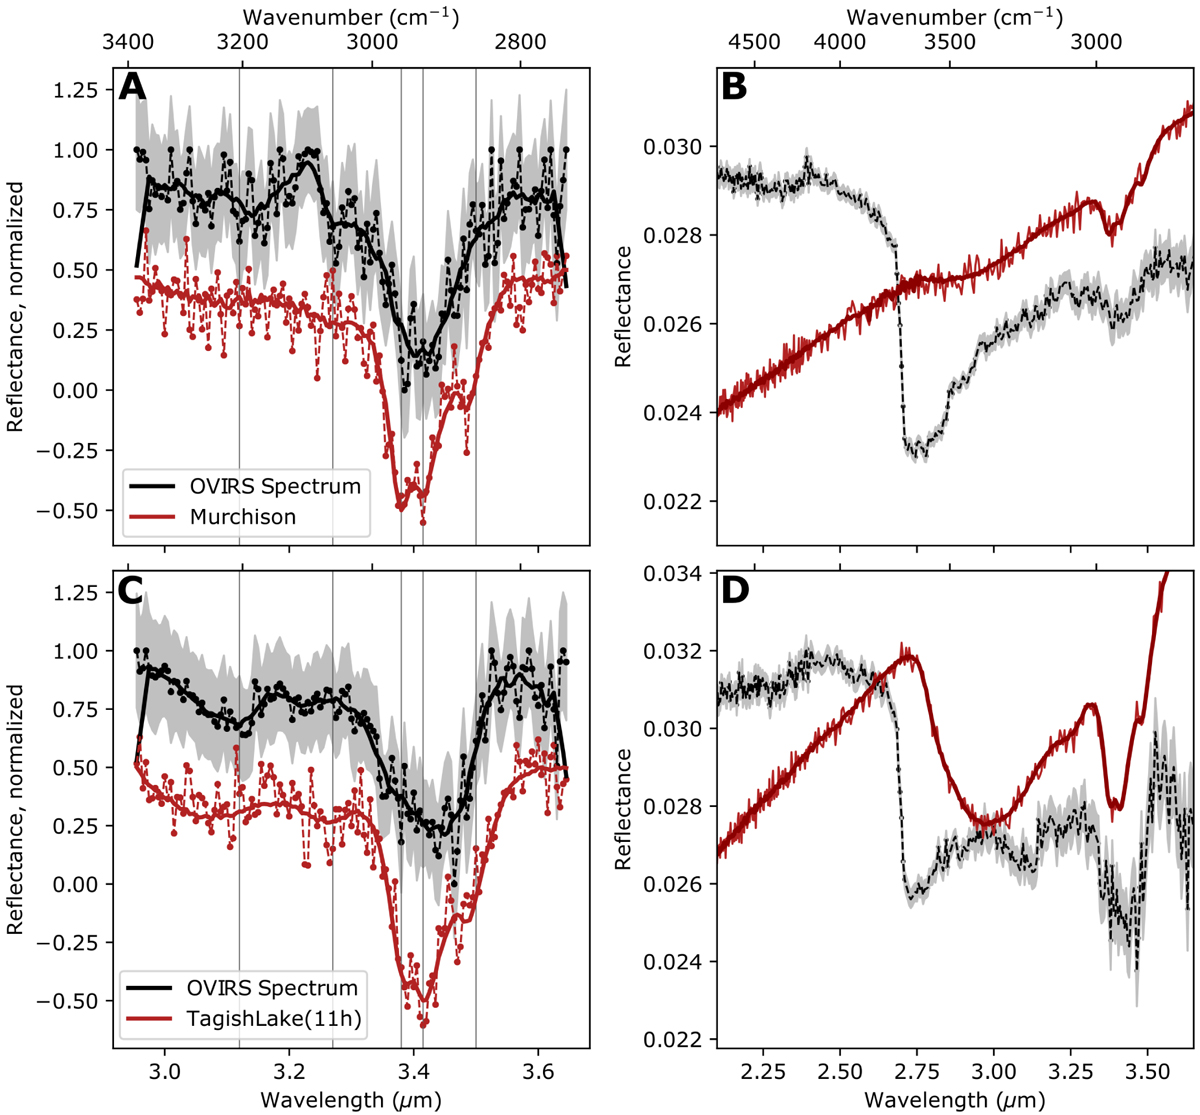
Fig. 2.
Download original image
Laboratory spectral matches for organic spectral shapes observed on Bennu. The most common spectral shapes in the Bennu spectra that we analyzed are well matched with spectra of meteorite IOM. (a) and (c) Best fits in the 3.1 to 3.6 μm region between the OVIRS spectra (black) and the IOM spectra (red, solid), with noised added to simulate OVIRS noise (red, dashed); the spectra are normalized from 0 to 1 and offset for clarity. The shaded region indicates uncertainties, and vertical lines at 3.10, 3.275, 3.38, 3.42, and 3.50 μm indicate positions of possible absorption features. (b) and (d) OVIRS and IOM spectra from 2.1 to 3.6 μm shown without normalization or continuum removal; IOM spectra have been scaled.
Current usage metrics show cumulative count of Article Views (full-text article views including HTML views, PDF and ePub downloads, according to the available data) and Abstracts Views on Vision4Press platform.
Data correspond to usage on the plateform after 2015. The current usage metrics is available 48-96 hours after online publication and is updated daily on week days.
Initial download of the metrics may take a while.