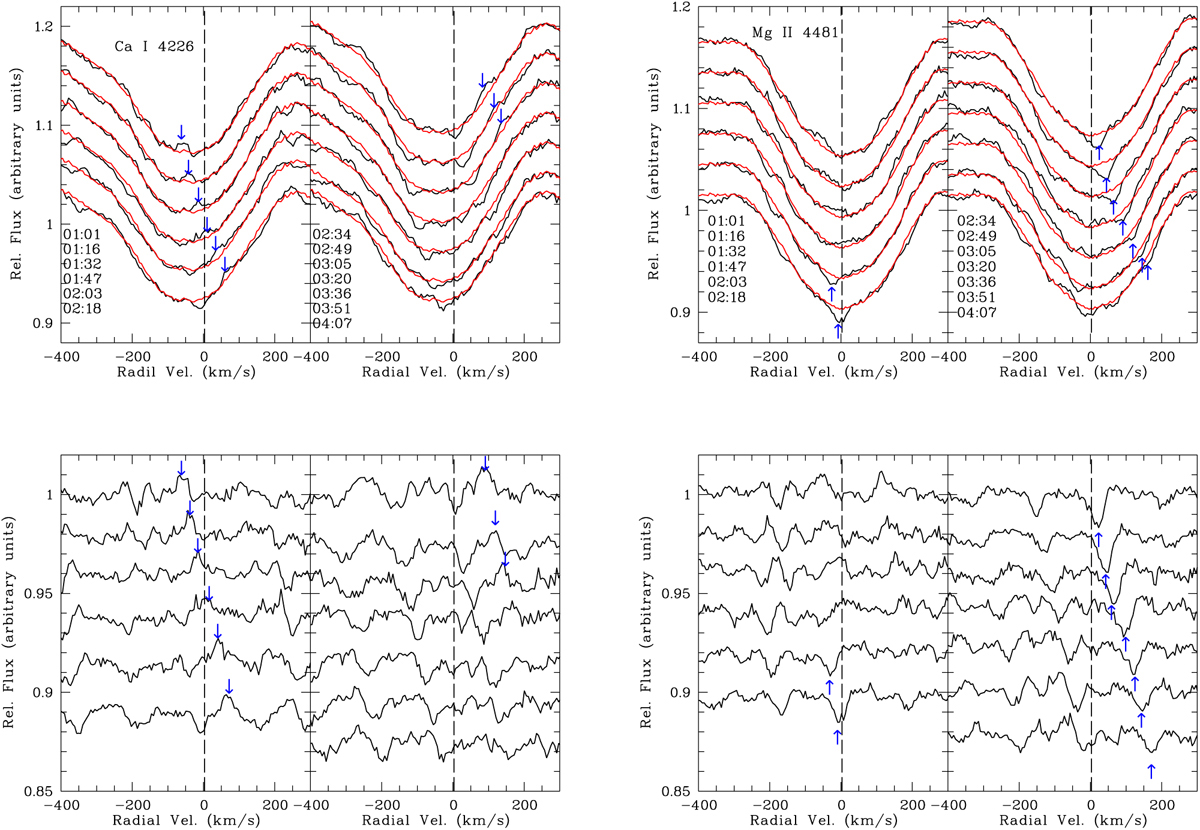
Fig. 4
Download original image
Ca I 4226 Å and Mg II 4481 Å absorption lines as observed in the 13 consecutive HARPS spectra taken during the night 2019-01-29/30. Exposure time was 15 min per spectrum. The dates and UTs of the spectra are given. Pixel resolution is 5.5 km s−1. The top panels show the observed line profiles while the bottom panels show the residuals once the median spectrum of the night has been removed. The median spectrum of the night is plotted in red. The blue arrows mark some examples of bumps (in the Ca I panels) and dumps (in the Mg II panels). The black dashed line in all panels corresponds to a radial velocity of 3 km s−1 (see text in Sect. 4.2 and Fig. 5).
Current usage metrics show cumulative count of Article Views (full-text article views including HTML views, PDF and ePub downloads, according to the available data) and Abstracts Views on Vision4Press platform.
Data correspond to usage on the plateform after 2015. The current usage metrics is available 48-96 hours after online publication and is updated daily on week days.
Initial download of the metrics may take a while.