Fig. 3
Download original image
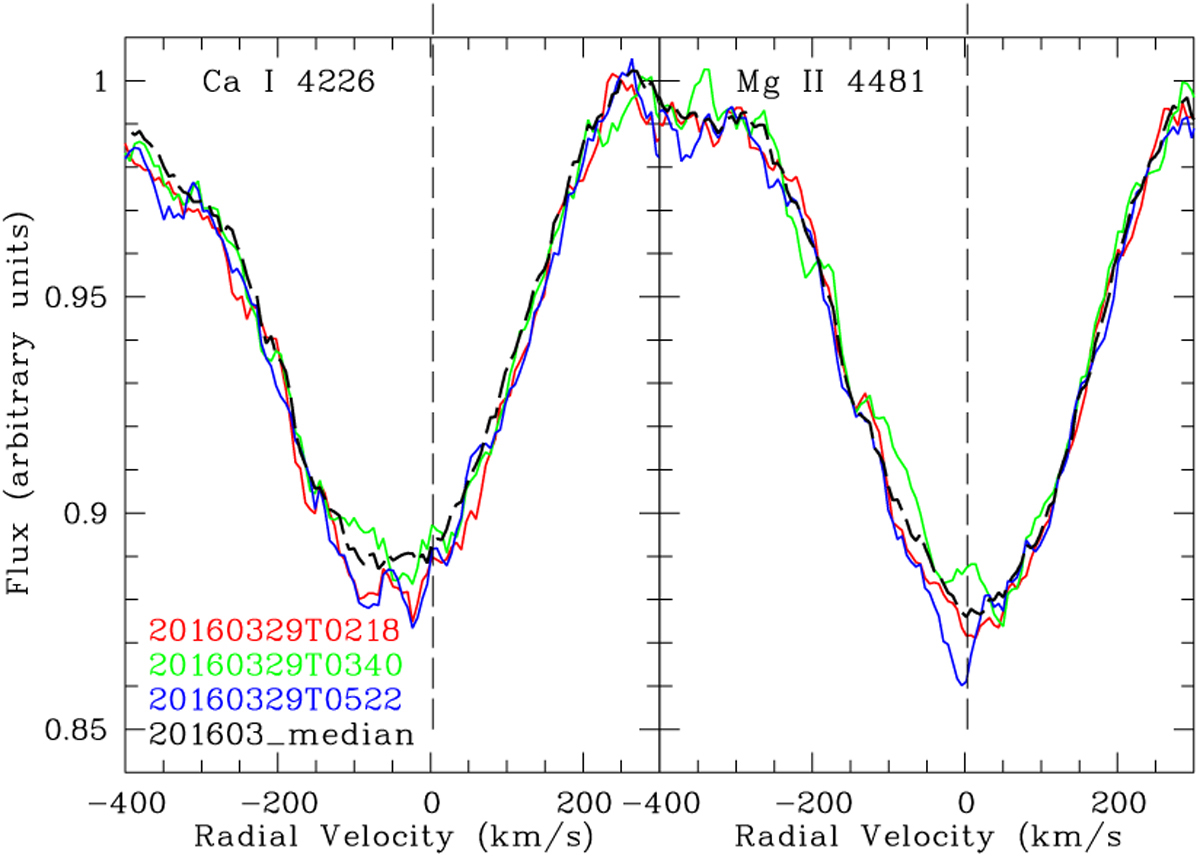
Ca I 4226 Å and Mg II 4481 Å lines observed with FEROS during the night of 2016-03-28/29. The spectra have been rebinned to a pixel spectral resolution of 6.39 km s−1. The date and UT of each spectrum are indicated. Black dashed line: median of the four-day period shown for comparison. We note the different behaviour of the extra absorption features of each line when compared to their median spectra. The vertical dashed line corresponds to a radial velocity of 3 km s−1 (see text in Sect. 4.2 and Fig. 5).
Current usage metrics show cumulative count of Article Views (full-text article views including HTML views, PDF and ePub downloads, according to the available data) and Abstracts Views on Vision4Press platform.
Data correspond to usage on the plateform after 2015. The current usage metrics is available 48-96 hours after online publication and is updated daily on week days.
Initial download of the metrics may take a while.