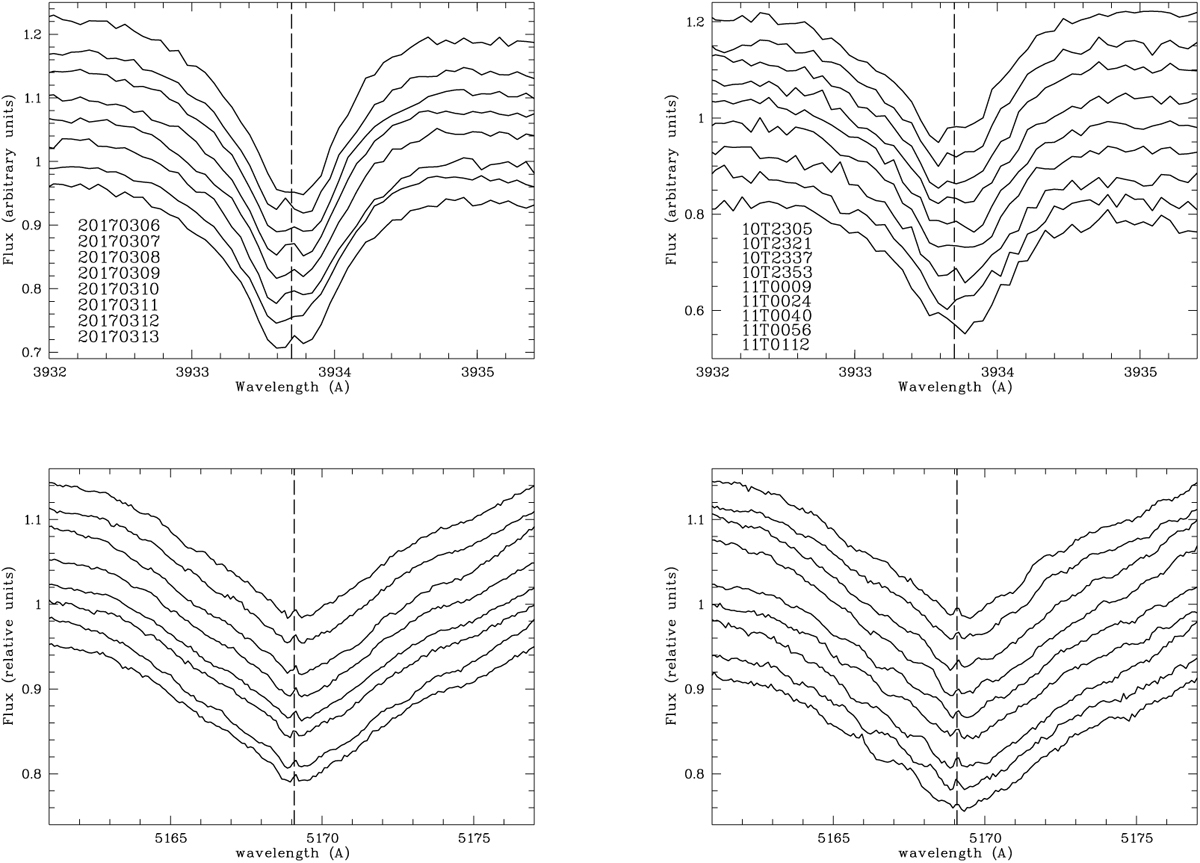
Fig. B.1
Download original image
Left: Nightly median of Ca II K and Fe II 5169 Å. Dates are indicated in the labels. Right: Some consecutive spectra taken during the night 2017-03-10/11. Exposure time of each spectrum is 15 minutes. The resolution of the Ca II spectra isis 0.0625 Å/pixel, while for Fe II is 0.0938 Å/pixel. Ca II K shows variability from night to night as well as irregular short timescale variability in individual nights. The central emission is seen in some of the nights, and both blue- and red-shifted minima change their relative strength. With respect to the Fe II line the central emission is present in all nights but the variability is less pronounced than the one in the K line and no correlation is seen.
Current usage metrics show cumulative count of Article Views (full-text article views including HTML views, PDF and ePub downloads, according to the available data) and Abstracts Views on Vision4Press platform.
Data correspond to usage on the plateform after 2015. The current usage metrics is available 48-96 hours after online publication and is updated daily on week days.
Initial download of the metrics may take a while.