Fig. A.3
Download original image
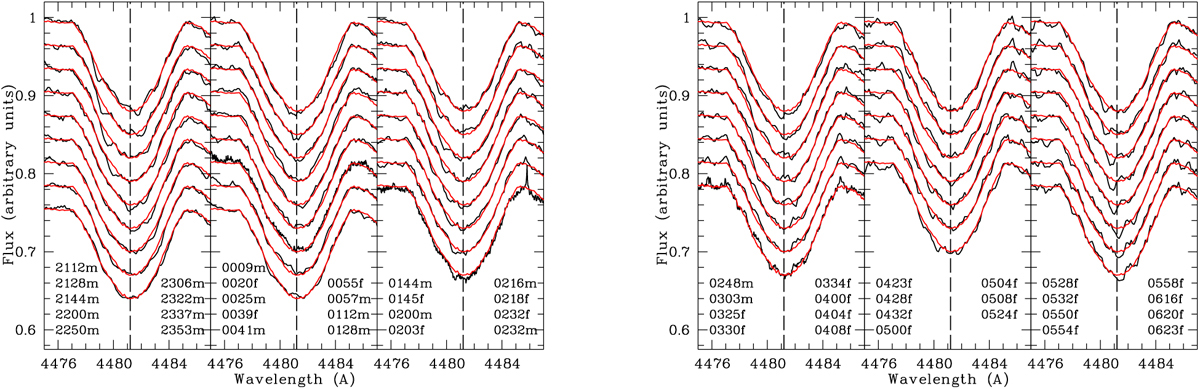
Profiles of the Mg II 4481 Å line as observed with HERMES and FEROS during the night of 2017-04-01/02 along ~9:30 hours. All spectra have been rebinned to 0.12 Å/pixel, and the median of the night is plotted in red superimposed on each spectrum. Spectra with ‘m’ in the labels refer to those obtained with HERMES and those with ‘f’ refer to FEROS. Labels correspond to spectra from top to bottom and then the two columns from left to right.
Current usage metrics show cumulative count of Article Views (full-text article views including HTML views, PDF and ePub downloads, according to the available data) and Abstracts Views on Vision4Press platform.
Data correspond to usage on the plateform after 2015. The current usage metrics is available 48-96 hours after online publication and is updated daily on week days.
Initial download of the metrics may take a while.