Fig. 10
Download original image
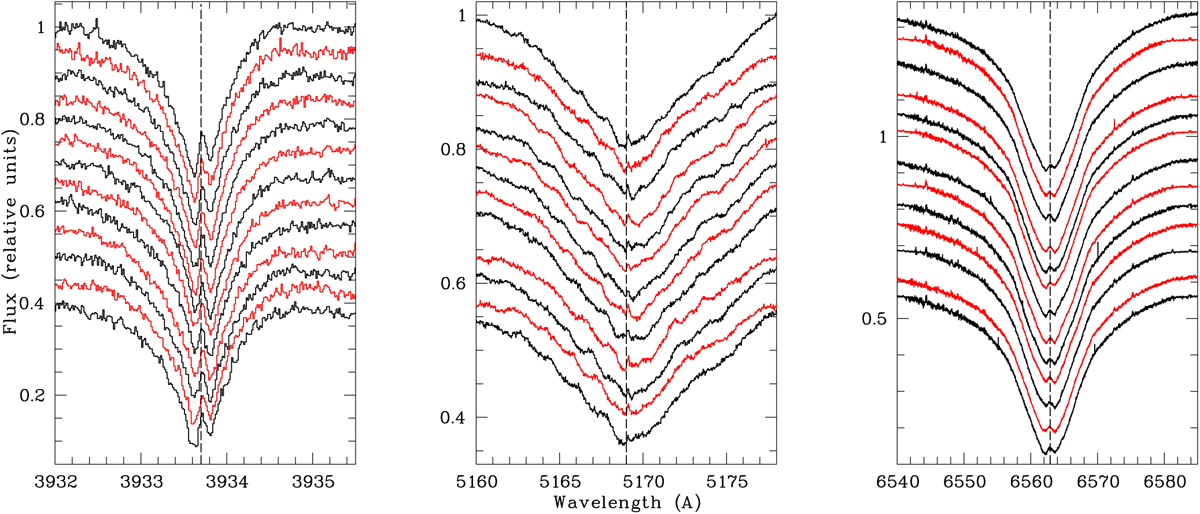
Ca II K (left panel, resolution 0.016 Å pixel−1), Fe II 5169 Å (middle, resolution 0.03 Å pixel−1)), Hα(right, resolution 0.01 Å pixel−1). Spectra were taken with HARPS-N during the night of 2019-01-29/30; each spectrum is 15 min apart starting 01h01m UT (first spectrum at the top) and finishing 04h07m UT (last spectrum at the bottom). The dashed line corresponds to a velocity of 3 km s−1.
Current usage metrics show cumulative count of Article Views (full-text article views including HTML views, PDF and ePub downloads, according to the available data) and Abstracts Views on Vision4Press platform.
Data correspond to usage on the plateform after 2015. The current usage metrics is available 48-96 hours after online publication and is updated daily on week days.
Initial download of the metrics may take a while.