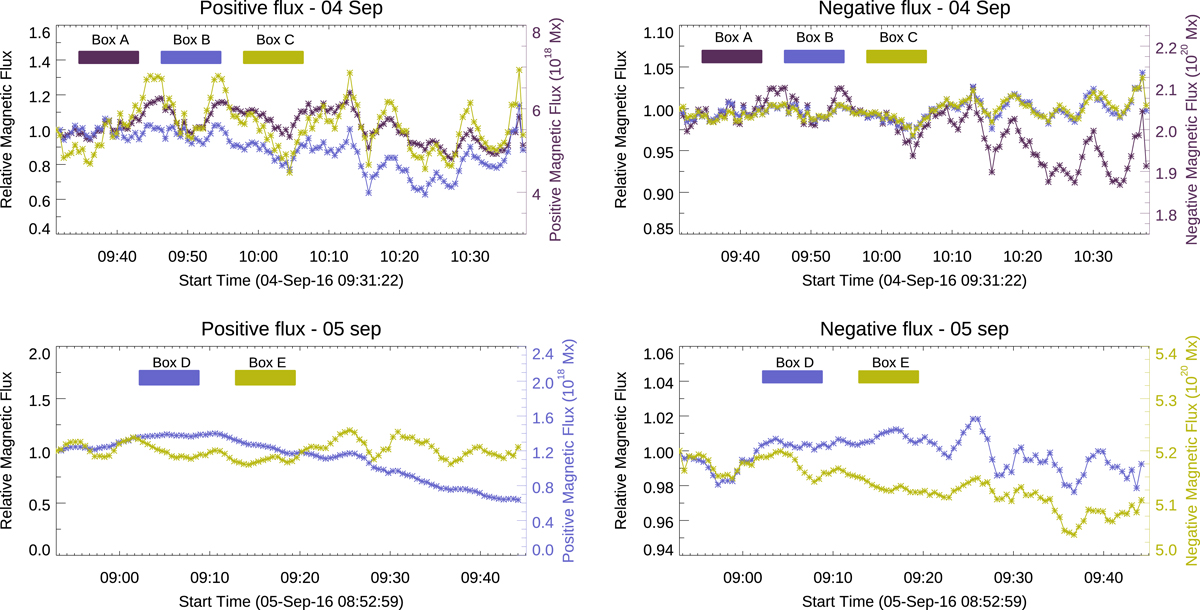
Fig. 8.
Download original image
Evolution of the positive (left panels) and negative (right panels) magnetic flux inside the three boxes indicated on the CP maps of Fig. 6 computed from the VFISV inversions of the SST/CRISP data on September 4 (top panels) and 5 (bottom panels). The symbols with different colors refer to the various analyzed boxes as specified in the legend.
Current usage metrics show cumulative count of Article Views (full-text article views including HTML views, PDF and ePub downloads, according to the available data) and Abstracts Views on Vision4Press platform.
Data correspond to usage on the plateform after 2015. The current usage metrics is available 48-96 hours after online publication and is updated daily on week days.
Initial download of the metrics may take a while.