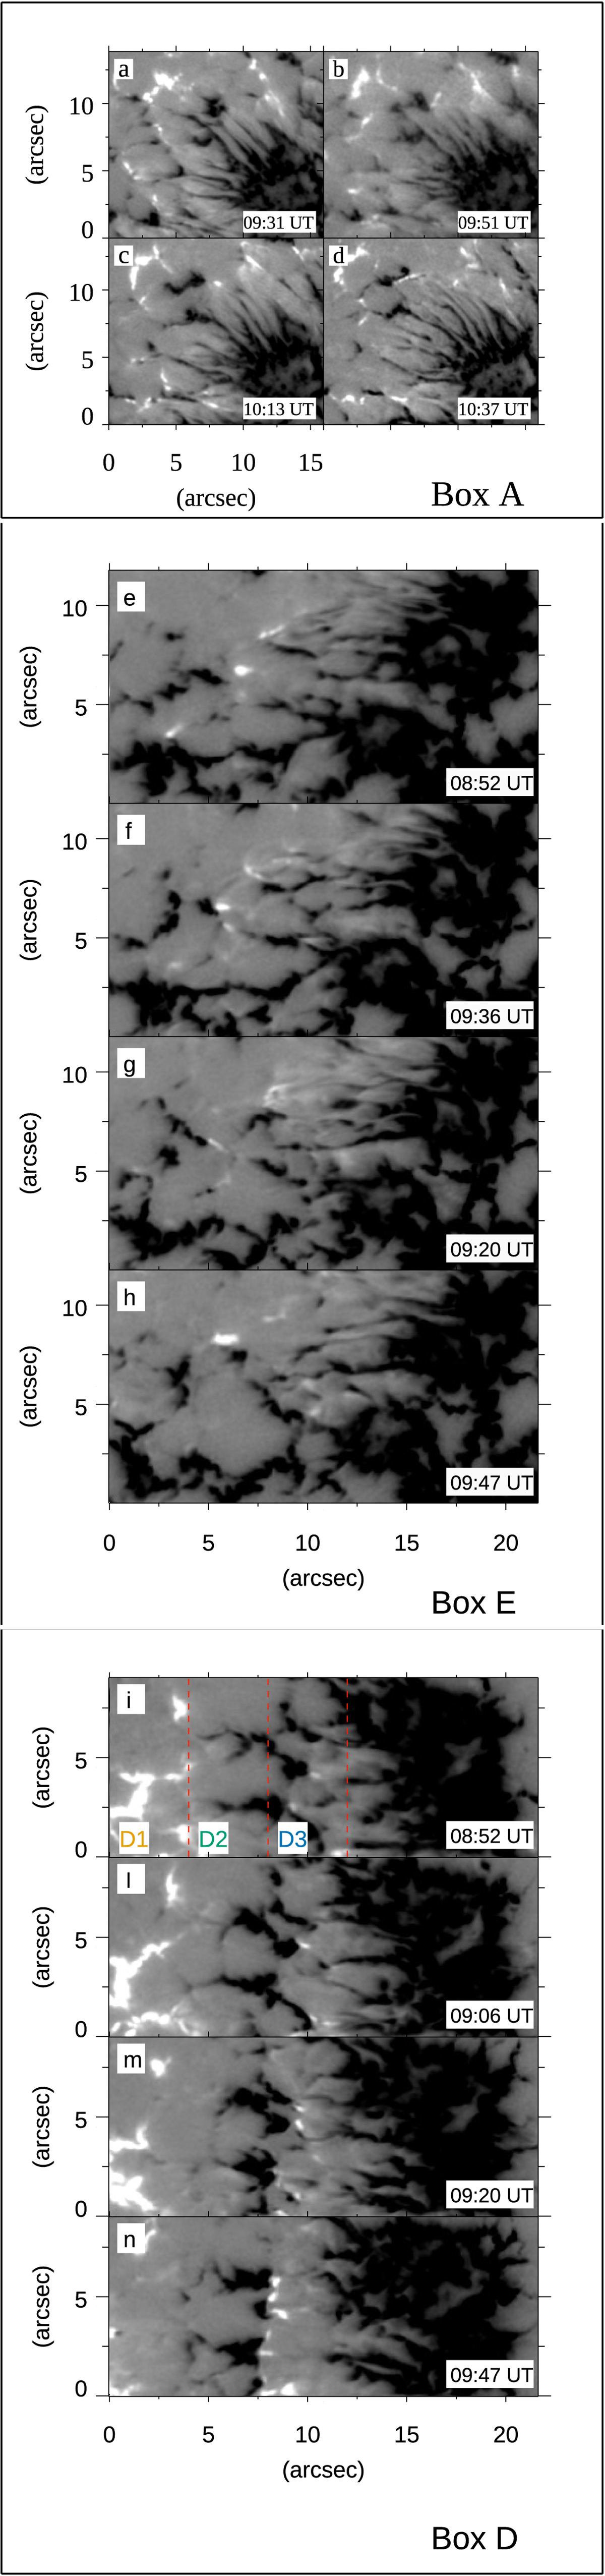
Fig. 7.
Download original image
Zoomed CP maps of the box A (panels a–d), E (panels e–h), and D (panels i–n) from the SST/CRISP data at four representative times on September 4 and 5. The boxes are indicated in Fig. 6. All the CP maps are scaled to ±0.05 CP/Ic. The three red dashed lines in the first panel relevant to Box D indicate the three regions for which the magnetic flux evolution reported in Fig. 9 has been computed.
Current usage metrics show cumulative count of Article Views (full-text article views including HTML views, PDF and ePub downloads, according to the available data) and Abstracts Views on Vision4Press platform.
Data correspond to usage on the plateform after 2015. The current usage metrics is available 48-96 hours after online publication and is updated daily on week days.
Initial download of the metrics may take a while.