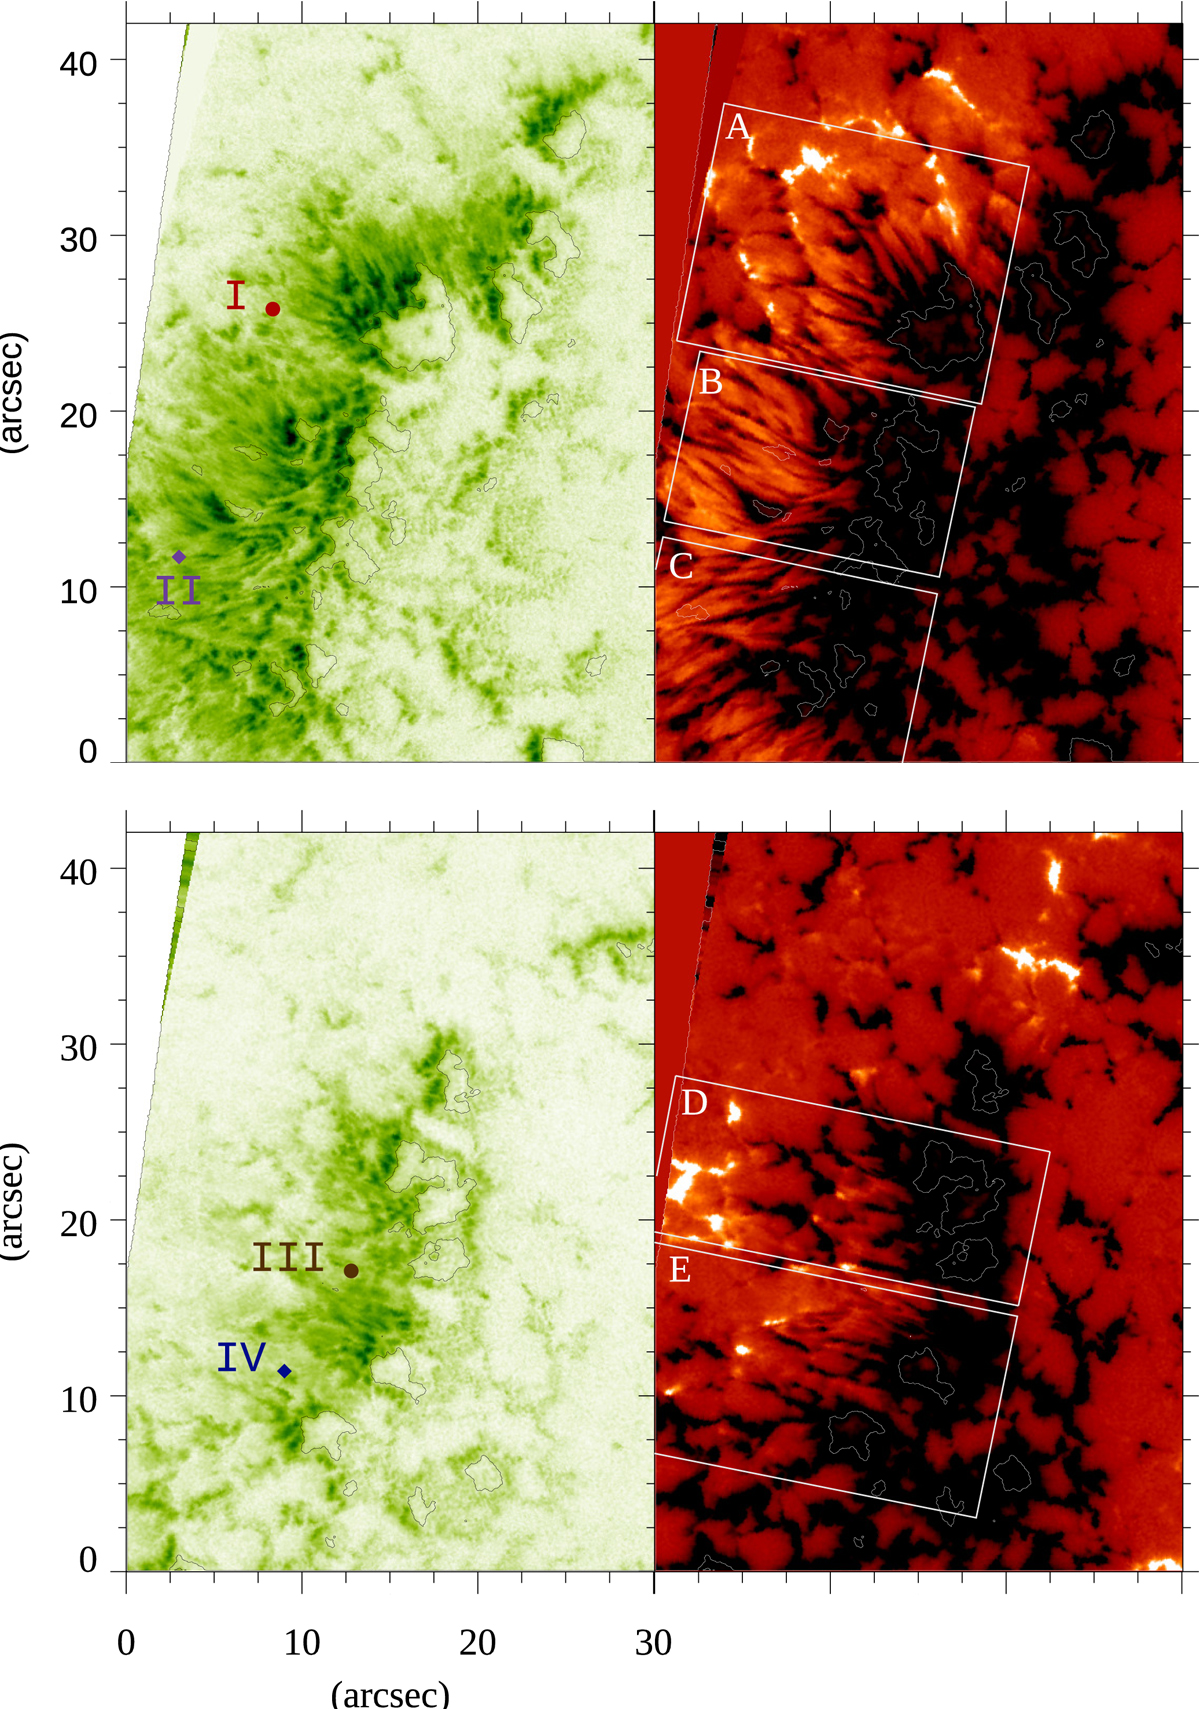
Fig. 6.
Download original image
LP and CP maps from SST/CRISP data at 09:31 UT (top panels) and 08:52 UT (bottom panels) on September 4 and 5, respectively. The boxes drawn on the CP maps indicate where the magnetic flux evolution shown in Fig. 8 has been computed. The LP and CP maps are scaled to 0.05 LP/Ic and ±0.05 CP/Ic, respectively. The colored symbols (I−IV) in LP panels refer to locations considered in Fig. 10. See Sect. 3.2 for more details.
Current usage metrics show cumulative count of Article Views (full-text article views including HTML views, PDF and ePub downloads, according to the available data) and Abstracts Views on Vision4Press platform.
Data correspond to usage on the plateform after 2015. The current usage metrics is available 48-96 hours after online publication and is updated daily on week days.
Initial download of the metrics may take a while.