Fig. 4.
Download original image
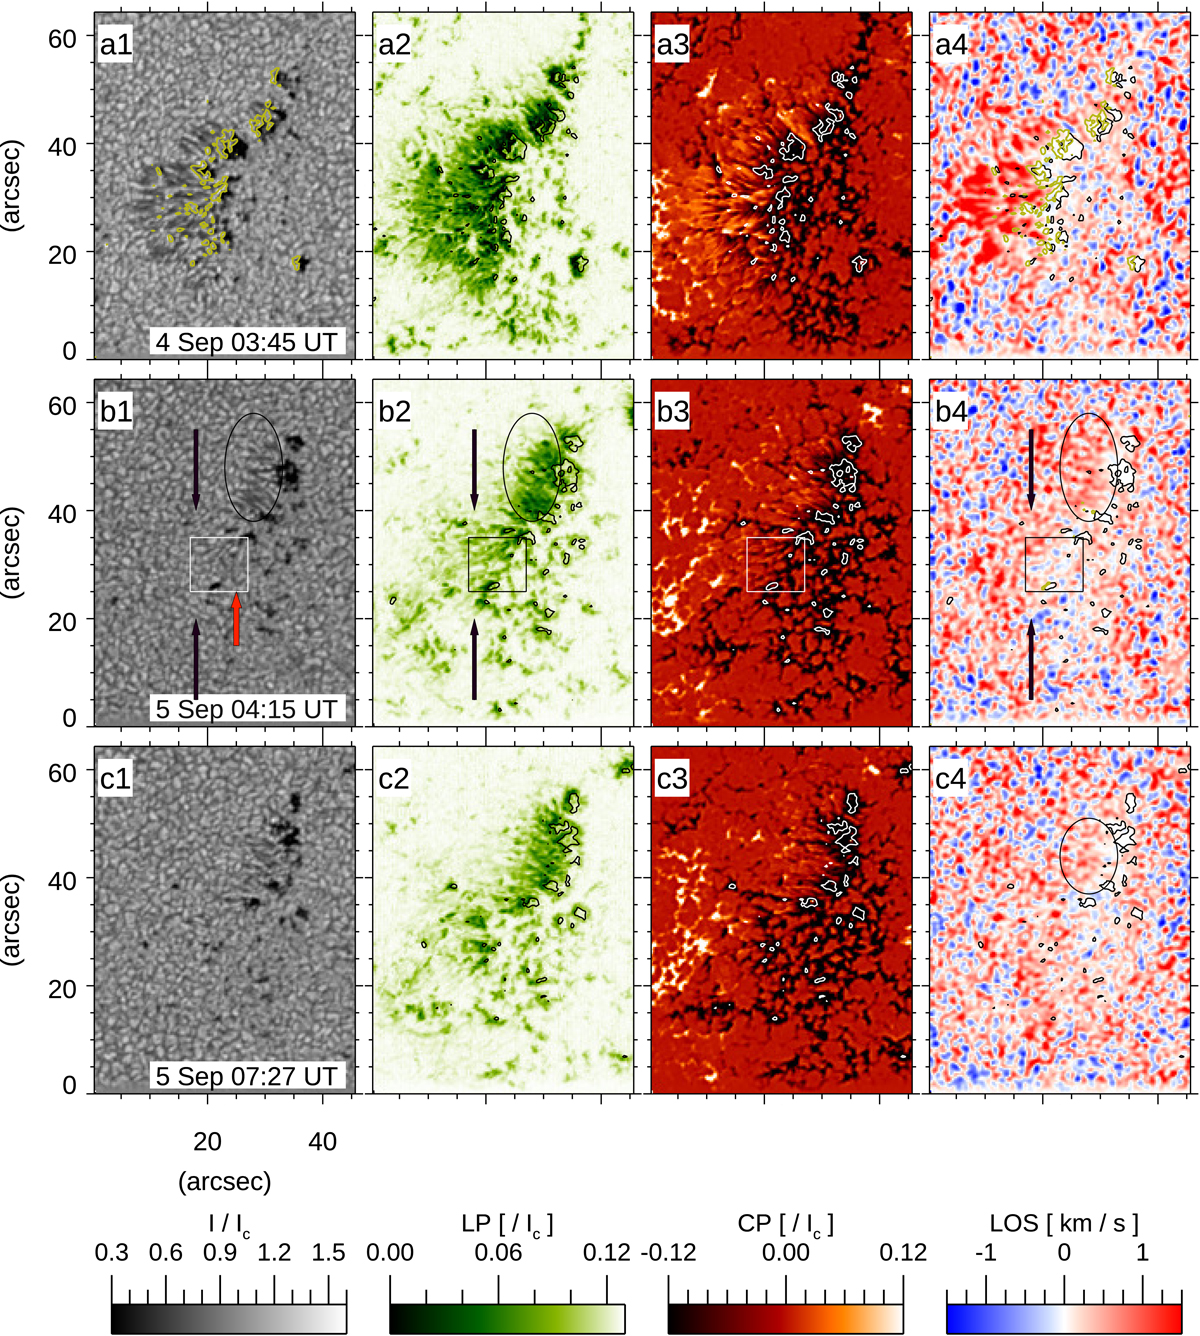
From left to right: continuum intensity, LP, CP, and LOS velocity relevant to the data acquired during the three Hinode/SP raster scans. The sub-FOV is the same as the blue box shown in Fig. 1. The black/white contours represent the edge of the umbra (Ic = 0.6) as seen in the continuum intensity. The light green contour in the first continuum and LOS velocity maps indicates contour at 0.1 LP/Ic. Arrows, ovals, and boxes point to regions and features described in Sect. 3.2.
Current usage metrics show cumulative count of Article Views (full-text article views including HTML views, PDF and ePub downloads, according to the available data) and Abstracts Views on Vision4Press platform.
Data correspond to usage on the plateform after 2015. The current usage metrics is available 48-96 hours after online publication and is updated daily on week days.
Initial download of the metrics may take a while.