Free Access
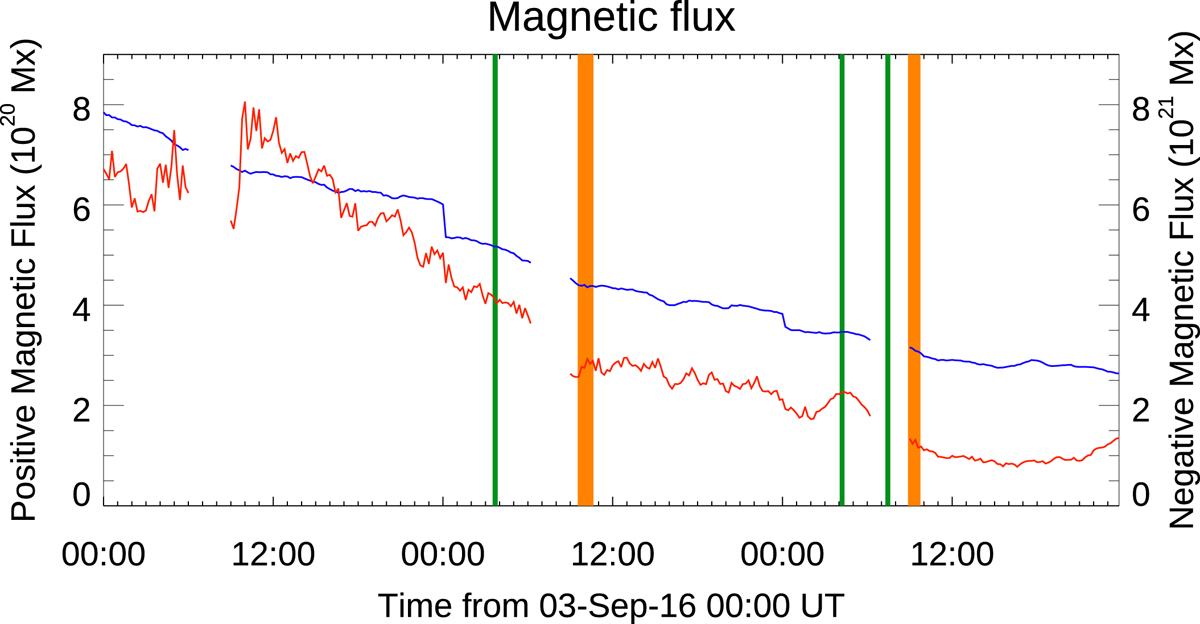
Fig. 3.
Download original image
Evolution of positive (red) and negative (blue, absolute value) magnetic flux in the ROI (denoted with the orange box in Fig. 2) as derived from SDO/HMI measurements. The orange stripes represent the time of SST/CRISP observations, while the green stripes those of the Hinode/SP scans.
Current usage metrics show cumulative count of Article Views (full-text article views including HTML views, PDF and ePub downloads, according to the available data) and Abstracts Views on Vision4Press platform.
Data correspond to usage on the plateform after 2015. The current usage metrics is available 48-96 hours after online publication and is updated daily on week days.
Initial download of the metrics may take a while.