Fig. 10.
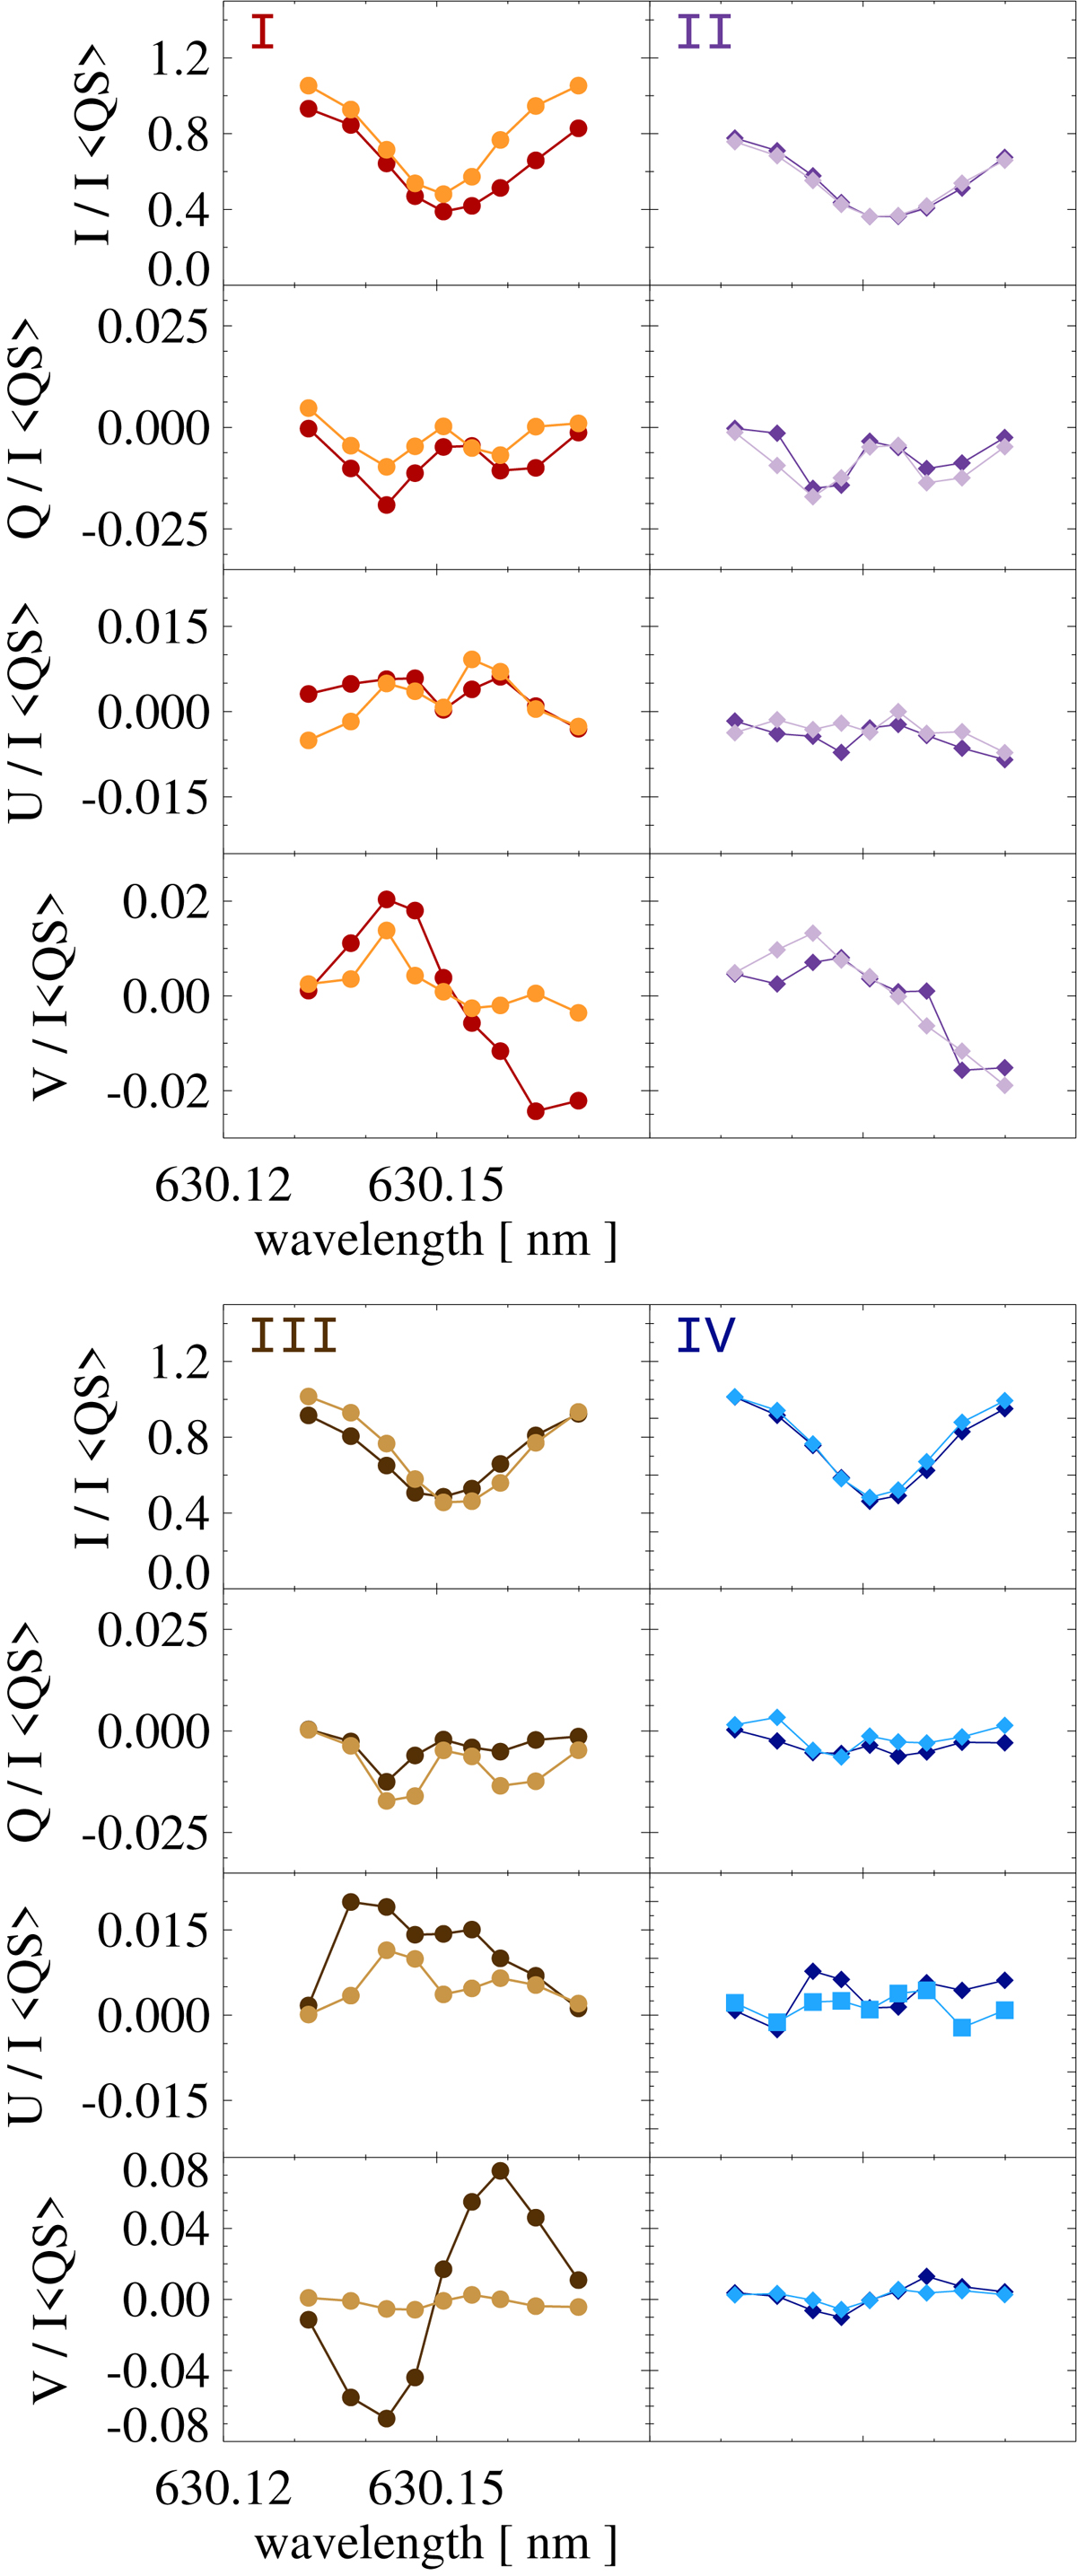
Download original image
Stokes profiles observed in the pixels (I−IV) denoted with colored filled symbols in the LP maps of Fig. 6 from SST/CRISP observations on September 4 and 5. From top to bottom: we show the four I, Q, U, and V Stokes profiles. The colors indicate initial (dark colors symbols) and final (light colors symbols) times of the observations.
Current usage metrics show cumulative count of Article Views (full-text article views including HTML views, PDF and ePub downloads, according to the available data) and Abstracts Views on Vision4Press platform.
Data correspond to usage on the plateform after 2015. The current usage metrics is available 48-96 hours after online publication and is updated daily on week days.
Initial download of the metrics may take a while.