Fig. 7
Download original image
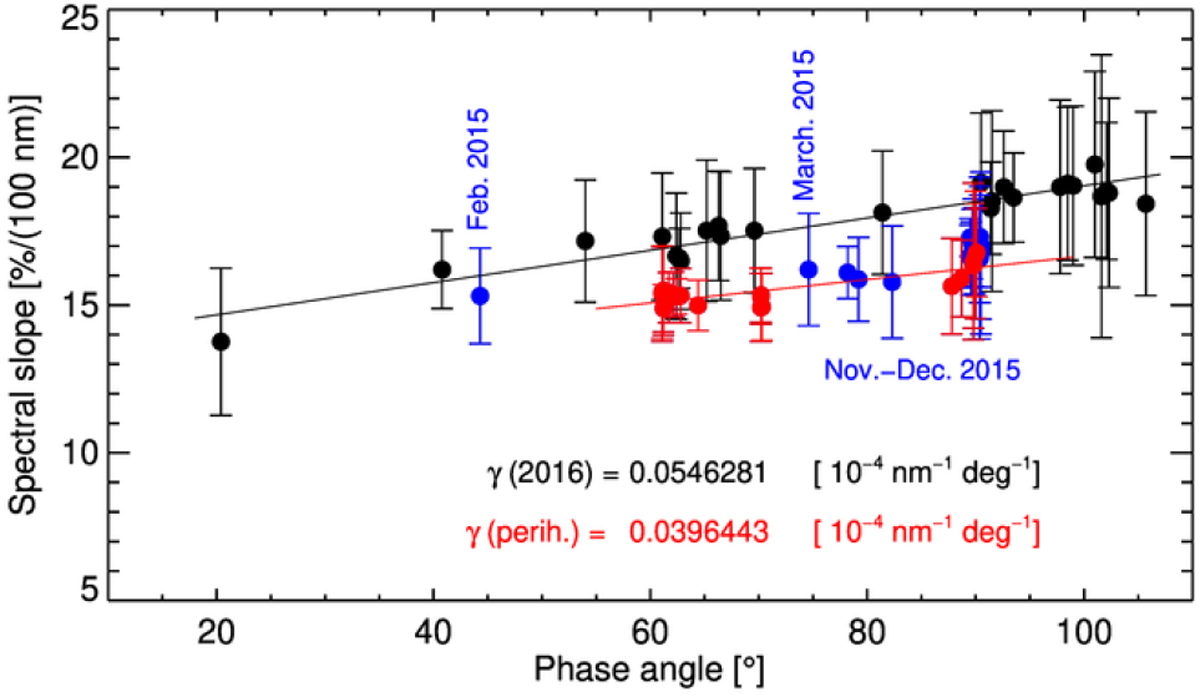
Phase reddening in spectral slopes evaluated in the 535–882 nm range. The black circles represent data acquired in 2016, redcircles those acquired in May–October 2015, that is three months before and after the perihelion passage, while the remaining 2015 data are represented with blue circles. The black and red lines are the linear fit of the 2016 and near perihelion data, respectively.
Current usage metrics show cumulative count of Article Views (full-text article views including HTML views, PDF and ePub downloads, according to the available data) and Abstracts Views on Vision4Press platform.
Data correspond to usage on the plateform after 2015. The current usage metrics is available 48-96 hours after online publication and is updated daily on week days.
Initial download of the metrics may take a while.