Fig. 11
Download original image
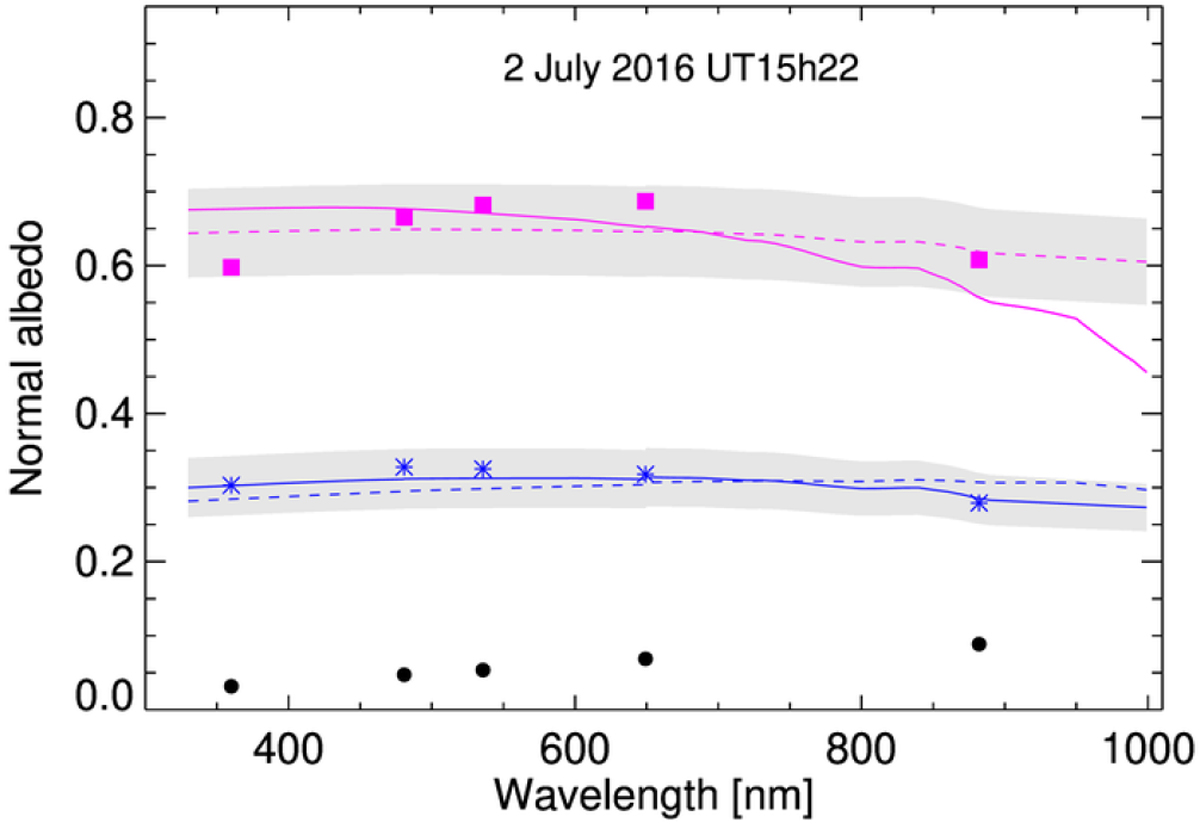
Normal albedo of the bright spots (indicated by the magenta squares and the blue asterisks, see Fig. 10) observed on 2 July 2016 UT15h22. The symbols correspond to the bright spots shown on the right panel of Fig. 10. The black circles represent the mean spectrum of the comet from a region close to the bright patches. Continuous and dashed lines show the best fit spectral models to the bright patches (in gray the associated uncertainty), produced by the linear mixture of the comet dark terrain enriched with 29 ± 3% of water ice with 1000 μm grain size (continuous line) for the ROI indicated by the blue asterisk, and with 65.5 ± 6.0% of water ice with 100 μm grain size (dashed line) for that represented by the magenta square. Models including water ice of medium and largegrain size are represented for comparison: dashed lines indicate models with water ice of 100 μm grain size, and continuous lines those with 1000 μm grain size.
Current usage metrics show cumulative count of Article Views (full-text article views including HTML views, PDF and ePub downloads, according to the available data) and Abstracts Views on Vision4Press platform.
Data correspond to usage on the plateform after 2015. The current usage metrics is available 48-96 hours after online publication and is updated daily on week days.
Initial download of the metrics may take a while.