Fig. 10
Download original image
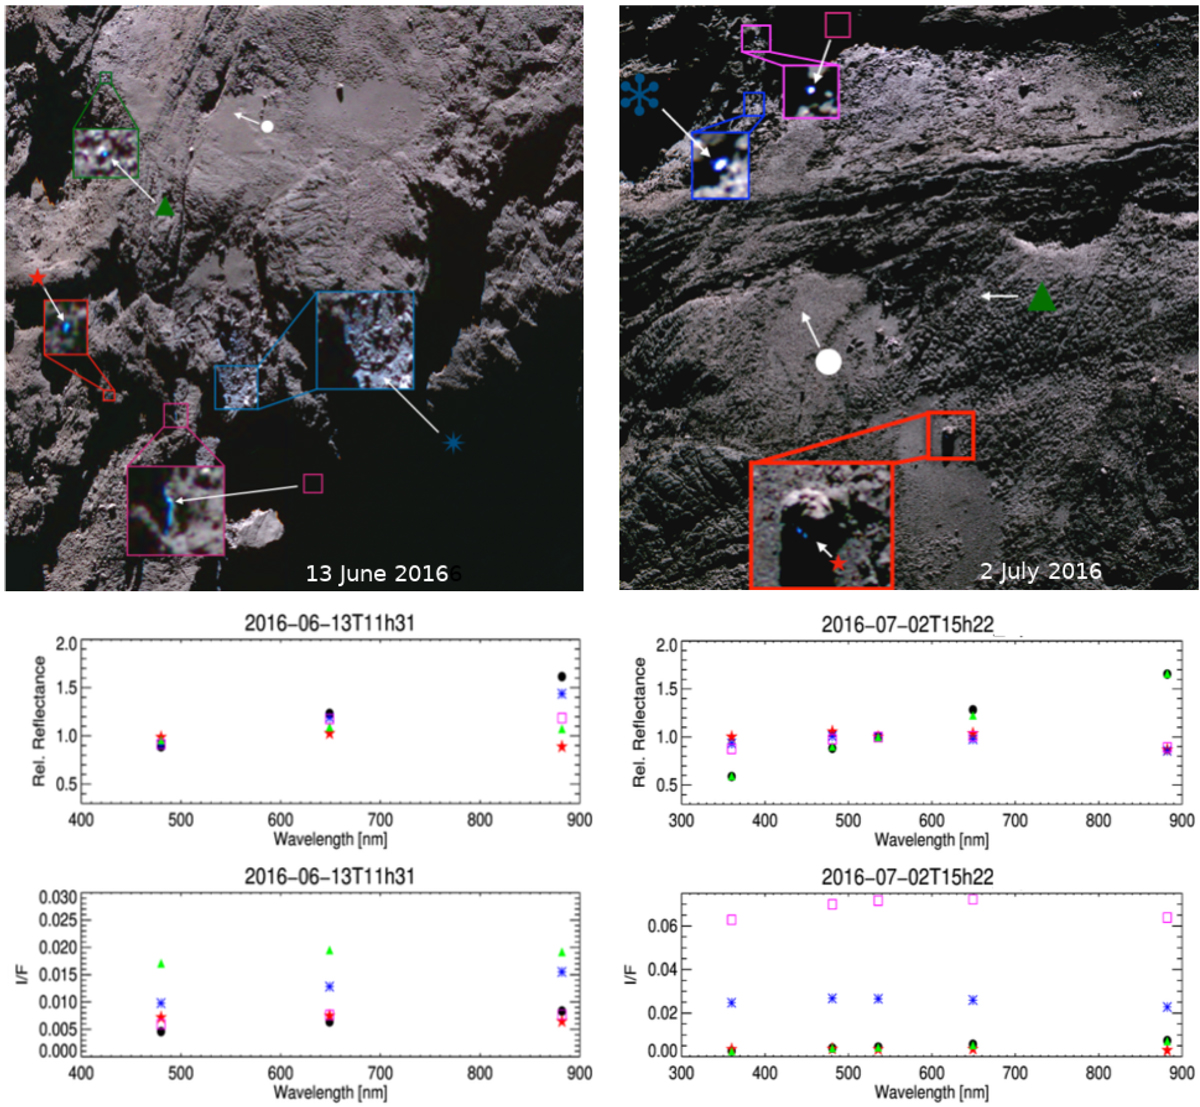
Wosret spectrophotometry. Top: examples of blue patches and bright spots from 13 June 2016 (left) and 2 July 2016 images (right). Inserts show a zoom of some ROIs. Middle and bottom panels: corresponding relative reflectance and the I over F value at the given phase angle (70° and 93° for the June and July images, respectively). The dark terrain used in the mixing model is represented by a circle in white for clarity in the RGB images on the top and in black in the plots.
Current usage metrics show cumulative count of Article Views (full-text article views including HTML views, PDF and ePub downloads, according to the available data) and Abstracts Views on Vision4Press platform.
Data correspond to usage on the plateform after 2015. The current usage metrics is available 48-96 hours after online publication and is updated daily on week days.
Initial download of the metrics may take a while.