Free Access
Fig. C.1
Download original image
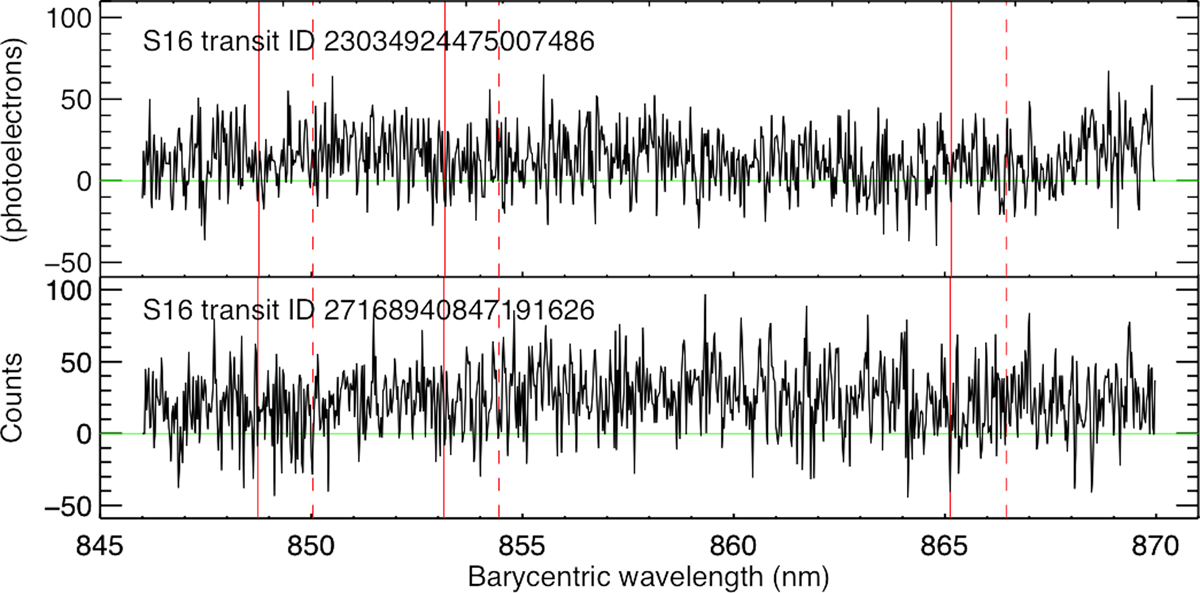
Two DR2 transit (three-CCD averaged) spectra of S16. The red dashed lines delineate where the Ca II absorption lines are expected to be when at rest. Although not unambiguously identifiable in the spectra, the red solid lines are the same lines, Doppler shifted according to the transit radial velocity.
Current usage metrics show cumulative count of Article Views (full-text article views including HTML views, PDF and ePub downloads, according to the available data) and Abstracts Views on Vision4Press platform.
Data correspond to usage on the plateform after 2015. The current usage metrics is available 48-96 hours after online publication and is updated daily on week days.
Initial download of the metrics may take a while.