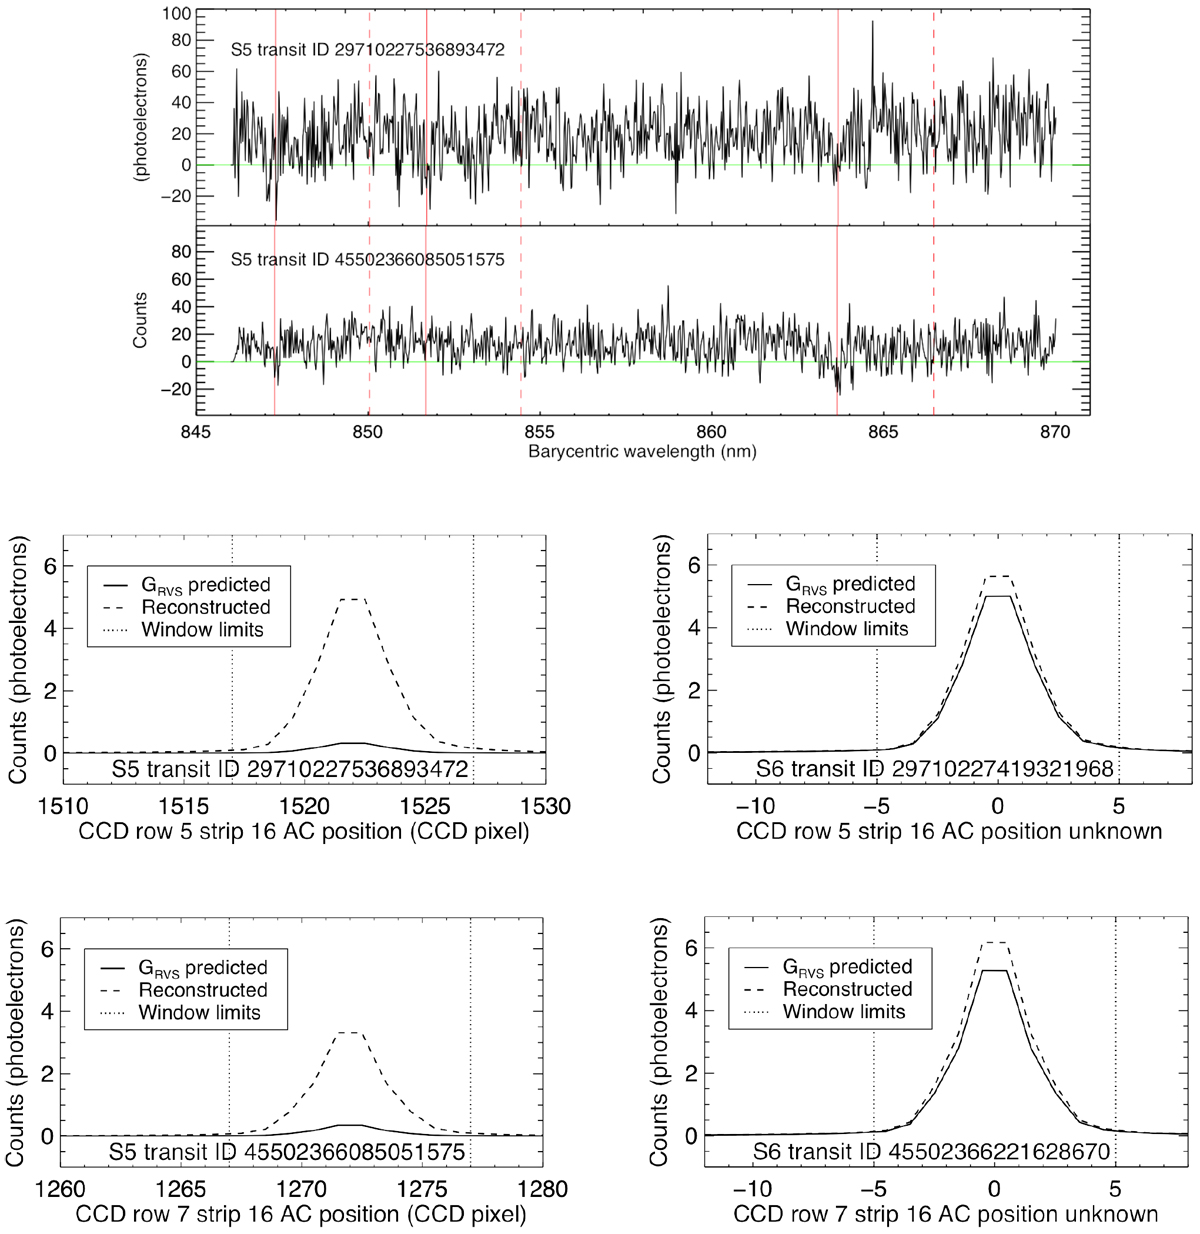
Fig. A.3
Download original image
DR2 transits of S5. Top plot: the two DR2 transit (three-CCD averaged) spectra of S5. The red dashed lines delineate the Ca II absorption line rest wavelengths. The red solid lines are the aforementioned rest wavelengths, Doppler shifted according to the transit radial velocity. GRVS -predicted and reconstructed AC profiles of S5 and S6 in the first transit (middle two plots) and the second transit (bottom two plots). S6 was processed by the CU6-DR3 pipeline, but the two transits closest in time to S5’s two transits were excluded because it could not be successfully deblended. Consequently, its window geometry information was not recorded, meaning its relative AL and AC positions and AC decentring are not known exactly. S5’s AC decentring is not known either because AC decentring is calculated in the CU6-DR3 pipeline and S5 was not processed by the CU6-DR3 pipeline. Consequently, the AC profiles in the middle and bottom panels are centred in the centre of their windows, but this may not be correct.
Current usage metrics show cumulative count of Article Views (full-text article views including HTML views, PDF and ePub downloads, according to the available data) and Abstracts Views on Vision4Press platform.
Data correspond to usage on the plateform after 2015. The current usage metrics is available 48-96 hours after online publication and is updated daily on week days.
Initial download of the metrics may take a while.