Fig. A.1
Download original image
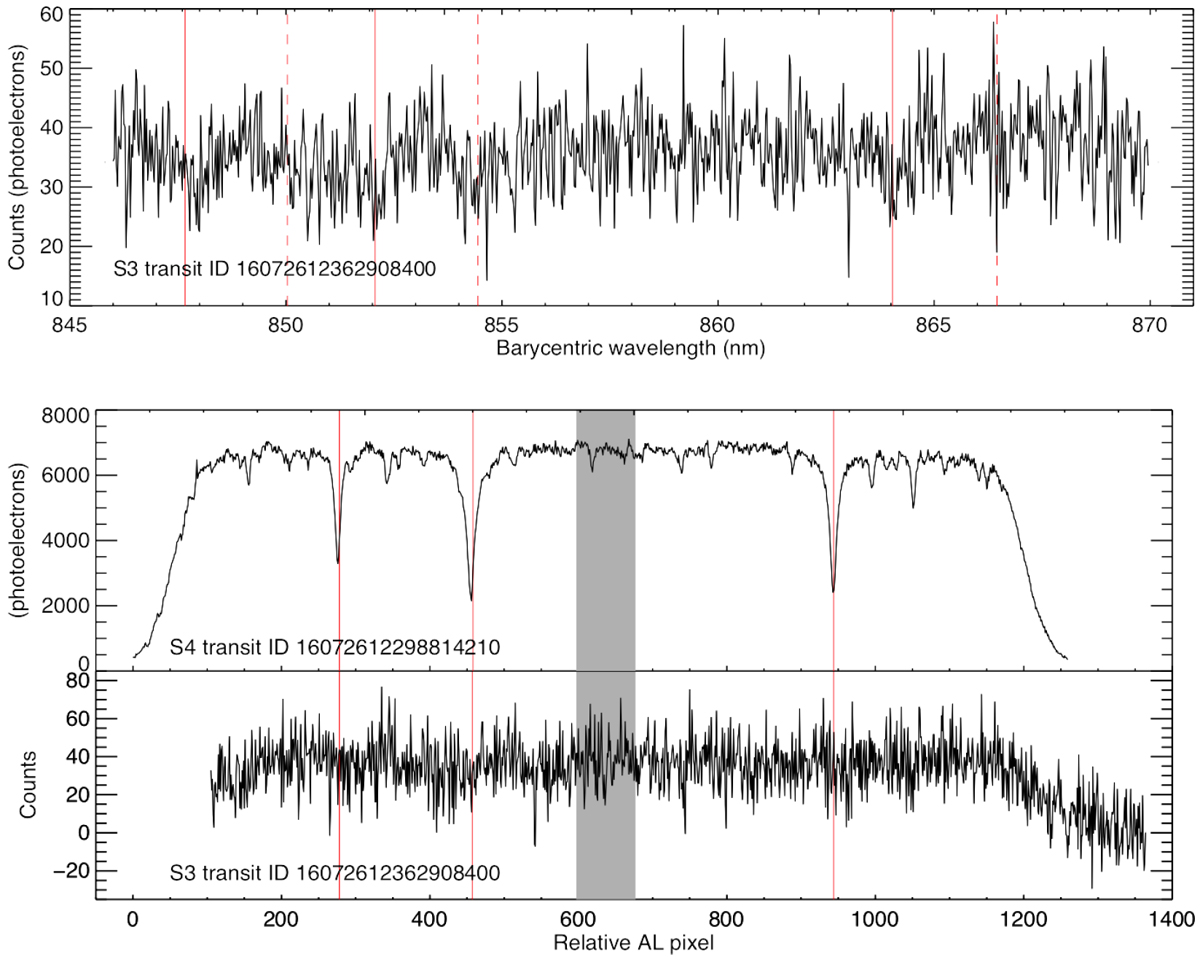
Spectra of the first DR2 transit of S3. Top plot: three-CCD averaged transit spectrum. The red dashed lines delineate the Ca II absorption line rest wavelengths. The red solid lines are the aforementioned rest wavelengths, Doppler shifted according to the transit radial velocity. Bottom plots: strip 16 (RVS strip 2) CCD spectra of the first DR2 transit of S3 and the corresponding transit of S4. The red vertical lines are the same as for the top plot, but it is plotted in relative AL pixel space. The grey shaded area corresponds to the central waveband in the top sub-panel: 858-860 nm, which corresponds to waveband 856-858 nm in the bottom sub-panel.
Current usage metrics show cumulative count of Article Views (full-text article views including HTML views, PDF and ePub downloads, according to the available data) and Abstracts Views on Vision4Press platform.
Data correspond to usage on the plateform after 2015. The current usage metrics is available 48-96 hours after online publication and is updated daily on week days.
Initial download of the metrics may take a while.