Free Access
Fig. 23
Download original image
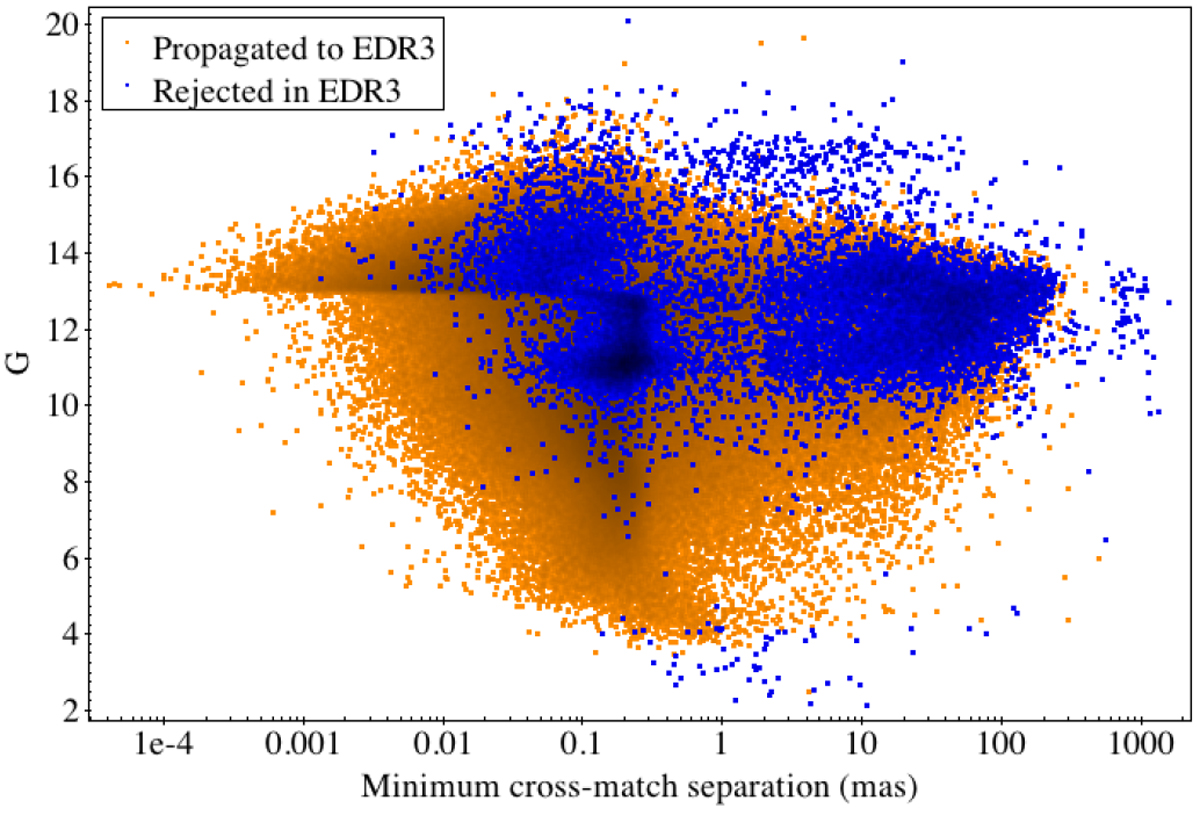
Angular separation between the original DR2 sources and their best match in EDR3 for sources having a radial velocity in DR2. The orange dots represent sources for which a radial velocity is propagated into EDR3, while blue dots correspond to those sources where the DR2 radial velocity is rejected.
Current usage metrics show cumulative count of Article Views (full-text article views including HTML views, PDF and ePub downloads, according to the available data) and Abstracts Views on Vision4Press platform.
Data correspond to usage on the plateform after 2015. The current usage metrics is available 48-96 hours after online publication and is updated daily on week days.
Initial download of the metrics may take a while.