Free Access
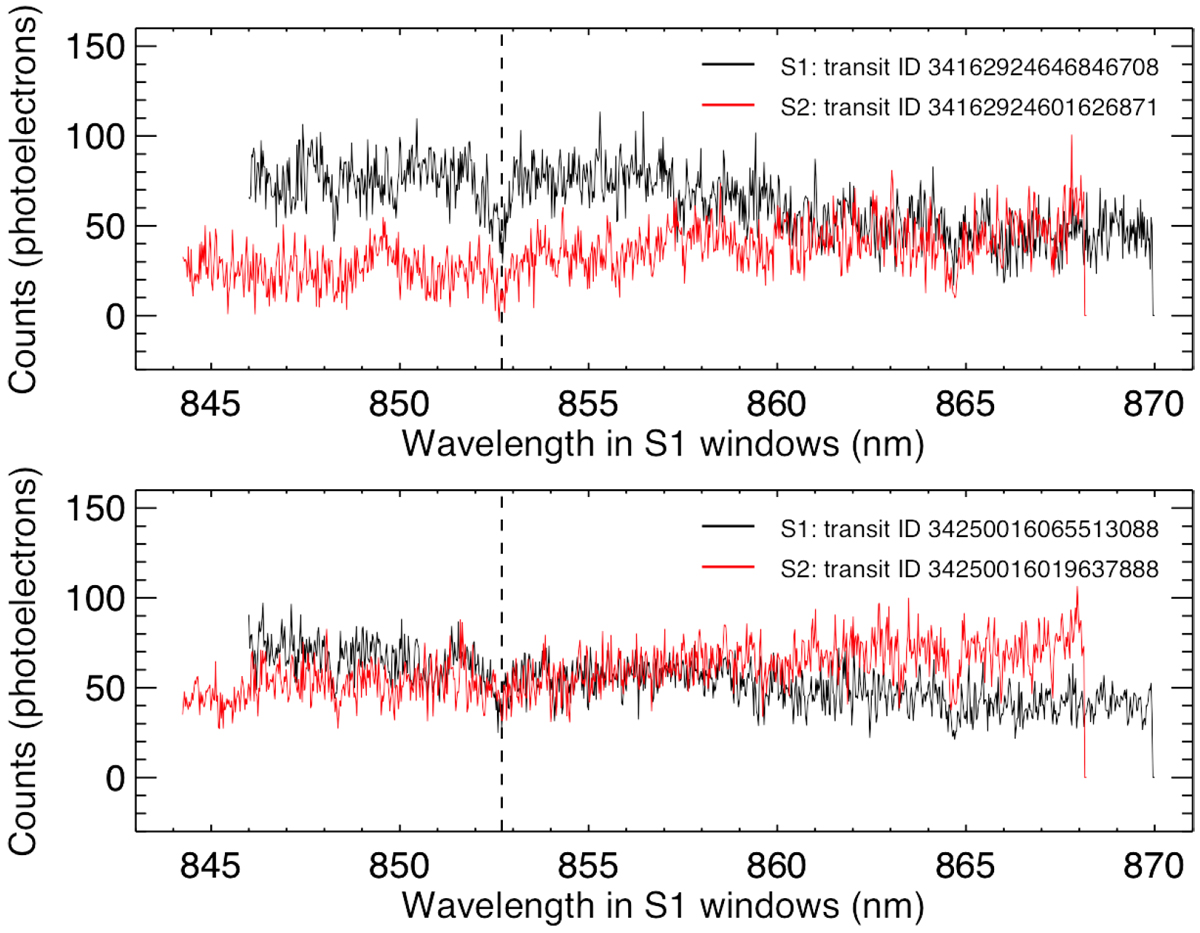
Fig. 2
Download original image
RVS transit spectra of the two transits of S1 and S2. The wavelength scale of the S2 spectra has been Doppler shifted to how it would appear in the S1 windows. The vertical dashed lines delineate the strongest (middle) Ca II line seen in boththe S1 and S2 spectra.
Current usage metrics show cumulative count of Article Views (full-text article views including HTML views, PDF and ePub downloads, according to the available data) and Abstracts Views on Vision4Press platform.
Data correspond to usage on the plateform after 2015. The current usage metrics is available 48-96 hours after online publication and is updated daily on week days.
Initial download of the metrics may take a while.