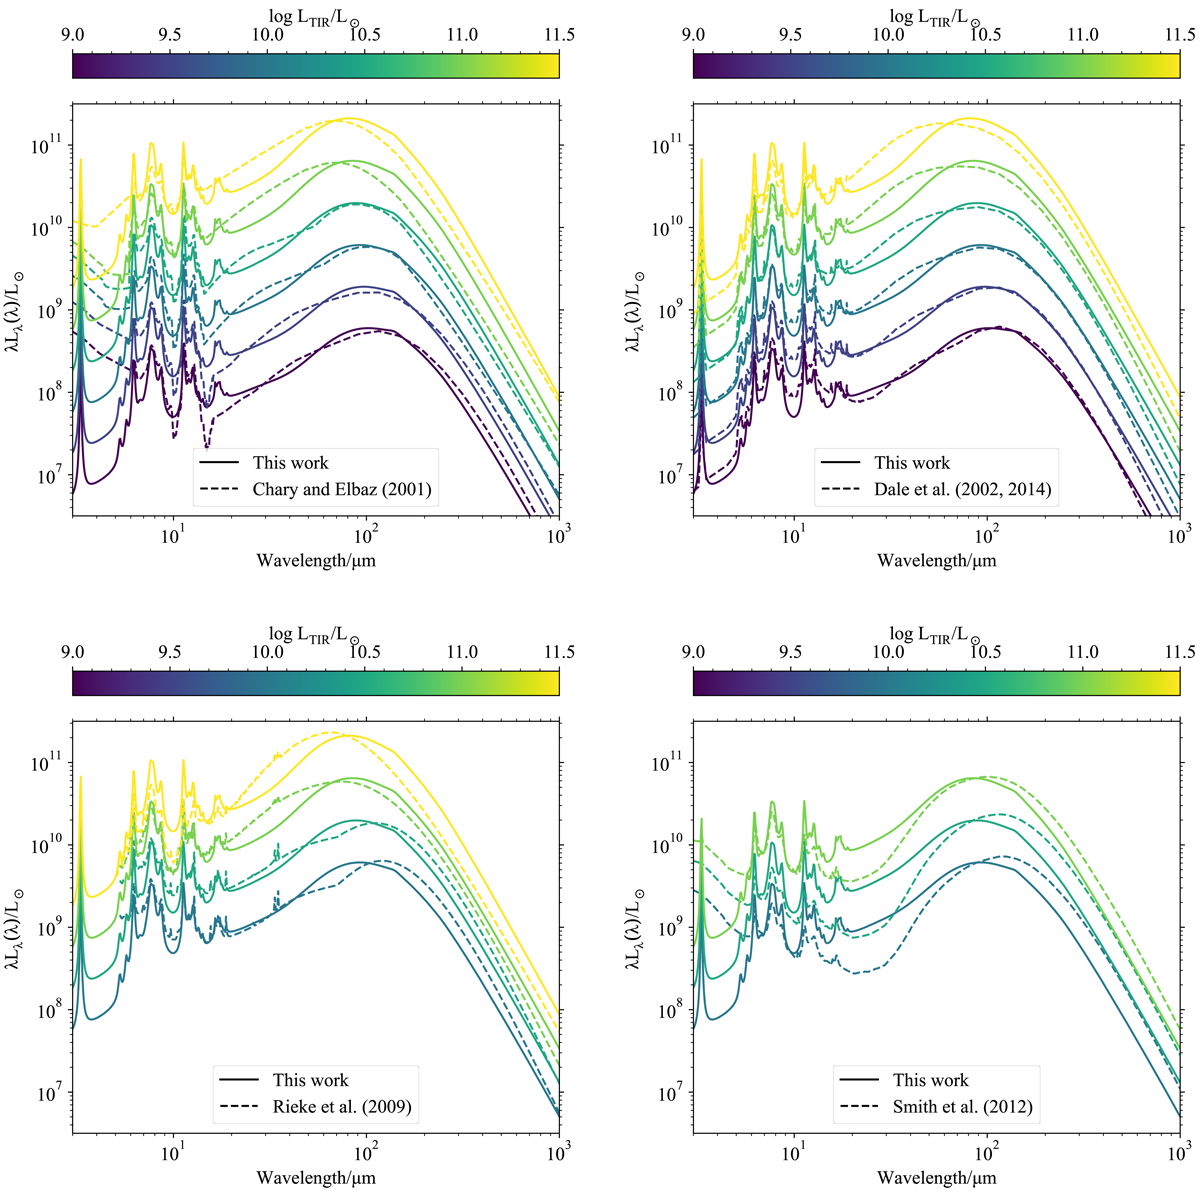
Fig. 9.
Download original image
Comparison of the templates derived in this work with those from Chary & Elbaz (2001) (top left), Dale & Helou (2002), Dale et al. (2014) (top right), Rieke et al. (2009) (bottom left), and Smith et al. (2012) (bottom right). The solid lines correspond to the new templates and the dashed lines the literature templates. Each pair of lines of the same color corresponds to log LTIR/L⊙ of 9.0, 9.5, 10.0, 10.5, 11.0, and 11.5, following the bar above each panel. Spectra outside of the definition range of a given set of templates have been omitted. The Chary & Elbaz (2001) and Smith et al. (2012) templates include stellar populations, precluding any comparison at short wavelengths where such populations dominate.
Current usage metrics show cumulative count of Article Views (full-text article views including HTML views, PDF and ePub downloads, according to the available data) and Abstracts Views on Vision4Press platform.
Data correspond to usage on the plateform after 2015. The current usage metrics is available 48-96 hours after online publication and is updated daily on week days.
Initial download of the metrics may take a while.