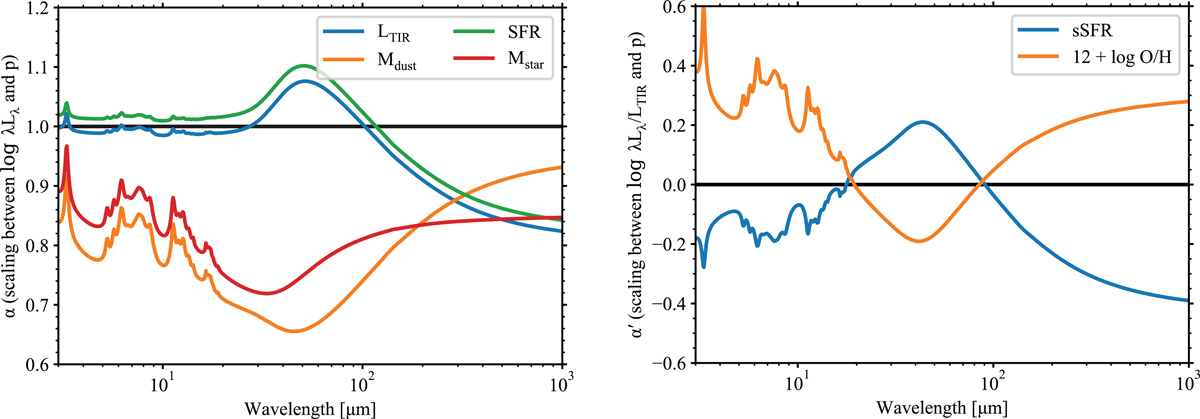
Fig. 4.
Download original image
Scaling coefficient between the monochromatic luminosity and a physical property versus the wavelength. The scaling coefficient α for the extensive properties LTIR (blue), Mdust (orange), SFR (green), and Mstar (red) is shown in the left panel. The scaling coefficient α′ for the intensive properties sSFR (blue) and the oxygen abundance (orange) is shown in the right panel. For the latter, λLλ has been normalized to LTIR, that is, it shows the residuals at fixed luminosity. The black horizontal lines indicate respectively the threshold between superlinearity and sublinearity (left), and between correlation and anticorrelation (right).
Current usage metrics show cumulative count of Article Views (full-text article views including HTML views, PDF and ePub downloads, according to the available data) and Abstracts Views on Vision4Press platform.
Data correspond to usage on the plateform after 2015. The current usage metrics is available 48-96 hours after online publication and is updated daily on week days.
Initial download of the metrics may take a while.