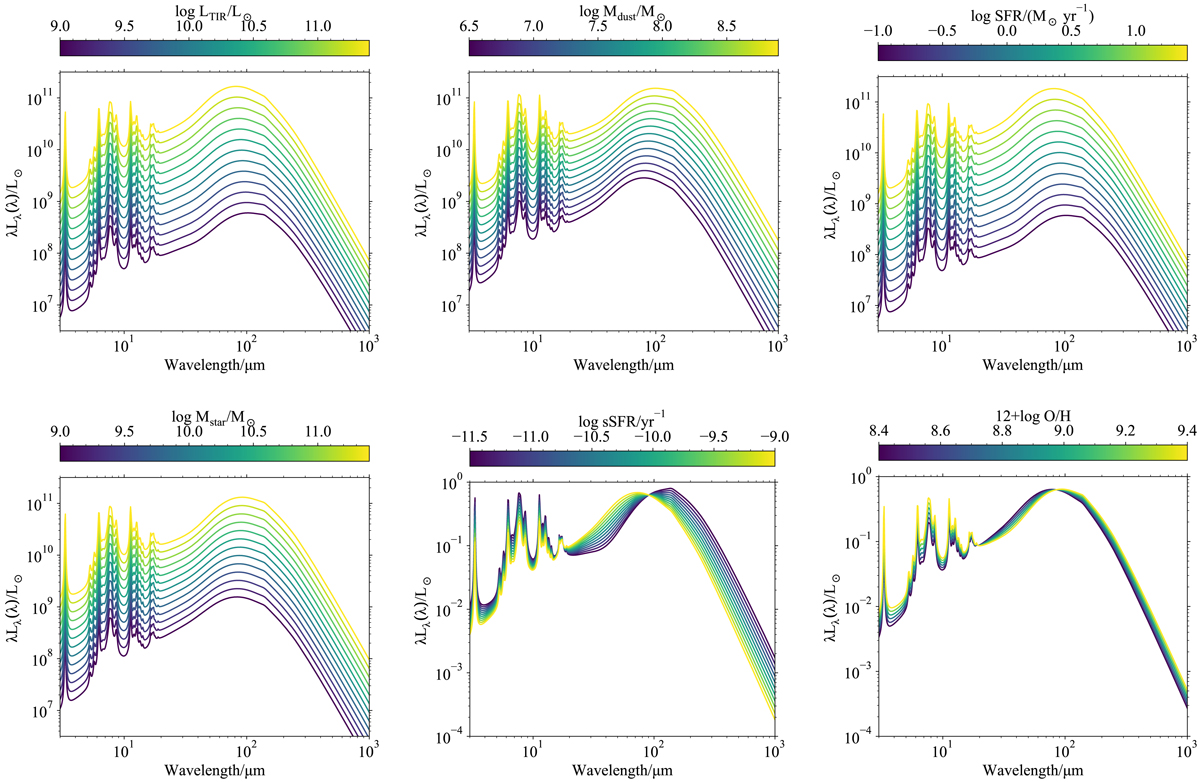
Fig. 3.
Download original image
From the top-left to the bottom-right, dust emission spectra parameterized on LTIR, Mdust, SFR, Mstar, sSFR, and the oxygen abundance. The spectra are calibrated in absolute luminosity for the extensive properties, but they are normalized to LTIR for the intensive properties. The color of each spectrum follows the corresponding physical property as indicated by the color bar above each panel.
Current usage metrics show cumulative count of Article Views (full-text article views including HTML views, PDF and ePub downloads, according to the available data) and Abstracts Views on Vision4Press platform.
Data correspond to usage on the plateform after 2015. The current usage metrics is available 48-96 hours after online publication and is updated daily on week days.
Initial download of the metrics may take a while.