Free Access
Fig. A.3
Download original image
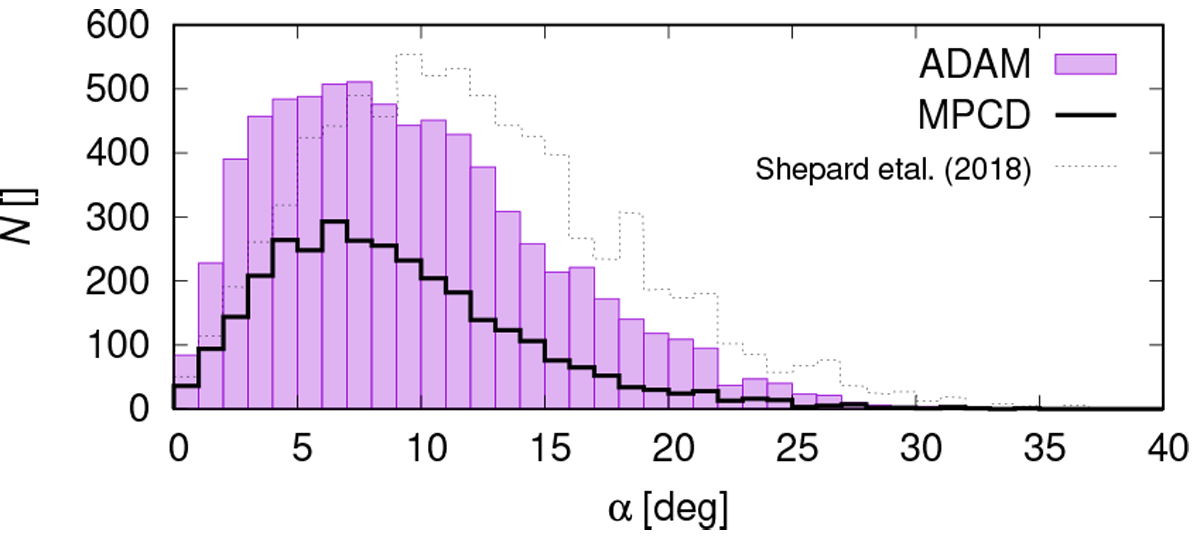
Histograms of slopes α for the ADAM and MPCD models. They are most commonly between 2° and 15°. The distribution is a bit wider for the ADAM model, with a few outliers. For comparison, we also plotted a histogram from Shepard et al. (2018).
Current usage metrics show cumulative count of Article Views (full-text article views including HTML views, PDF and ePub downloads, according to the available data) and Abstracts Views on Vision4Press platform.
Data correspond to usage on the plateform after 2015. The current usage metrics is available 48-96 hours after online publication and is updated daily on week days.
Initial download of the metrics may take a while.