Fig. 7.
Download original image
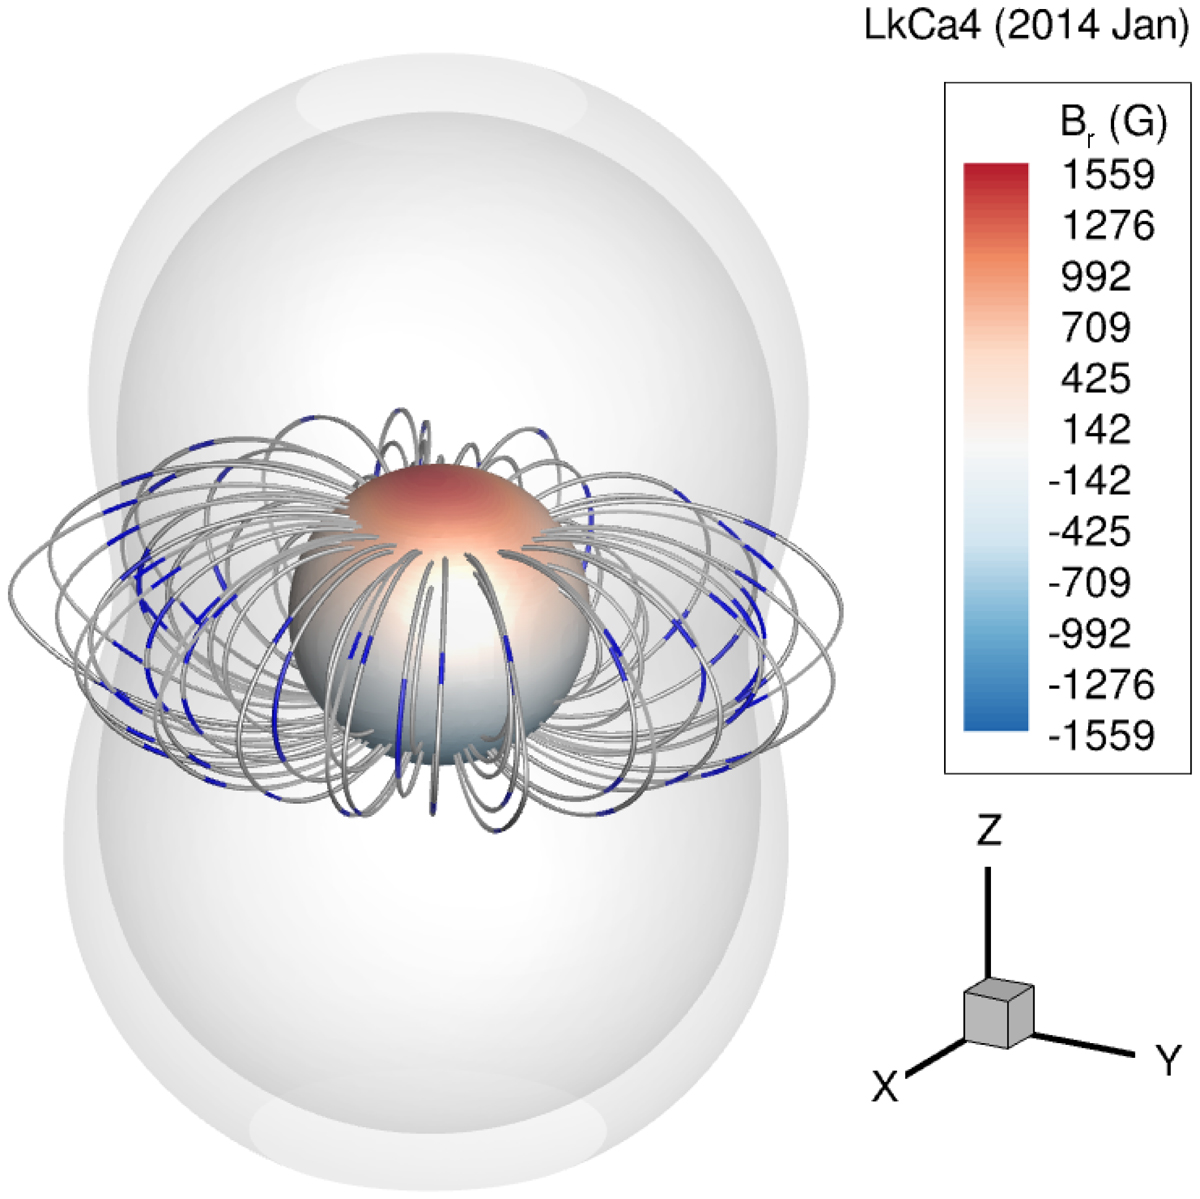
3D magnetic map of LkCa 4, obtained by extrapolating the surface magnetic field maps obtained by Donati et al. (2014). The positive magnetic field strength values indicate where the magnetic field is pointing outwards from the surface, while the negative values indicate where it is pointing inwards towards the surface. The model used to calculate this magnetic map assumes that the field lines become fully radial at 3.4R*. The grey surfaces indicate the region in the magnetosphere where the magnetic field strength is 40 − 70 G. The locations along the magnetic field lines where the magnetic field strength is in this range are indicated by the blue line segments. We note that only the closed magnetic field lines are shown in this figure.
Current usage metrics show cumulative count of Article Views (full-text article views including HTML views, PDF and ePub downloads, according to the available data) and Abstracts Views on Vision4Press platform.
Data correspond to usage on the plateform after 2015. The current usage metrics is available 48-96 hours after online publication and is updated daily on week days.
Initial download of the metrics may take a while.