Fig. 2.
Download original image
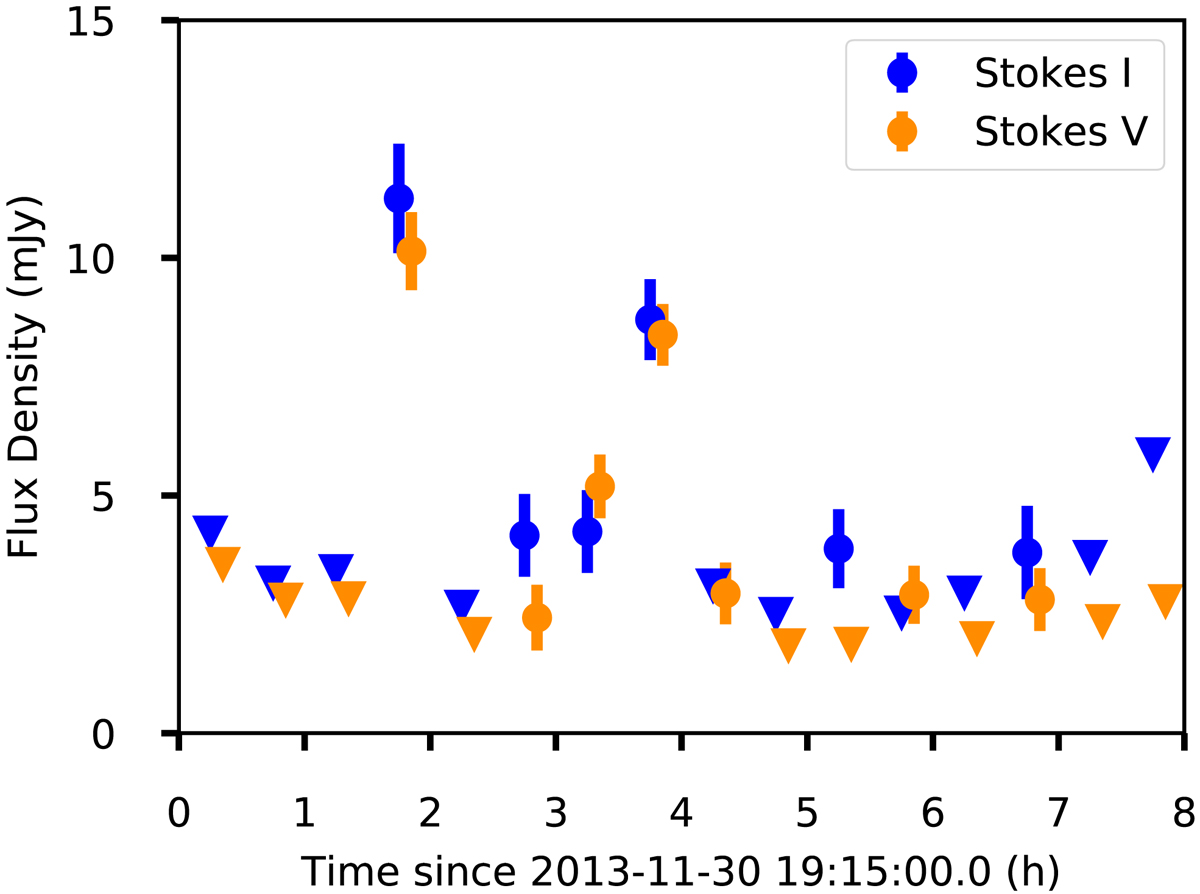
Light curve of KPNO-Tau-14 over the observation with a time resolution of 30 min. Stokes I and Stokes V measurements are shown by the blue and orange data points, respectively. The error bars are given by the root-mean-square noise σrms in the image. The Stokes V measurements are offset by +0.1 h with respect to the Stokes I measurements for better readability. We note that the absolute flux calibration error is not taken into account in the error bars as any absolute flux calibration offset should be the same for the whole observation. 3σ upper limits are shown by the triangles for the times in which no emission was detected from the source. See Appendix D for the flux density measurements and calculated polarisation fractions.
Current usage metrics show cumulative count of Article Views (full-text article views including HTML views, PDF and ePub downloads, according to the available data) and Abstracts Views on Vision4Press platform.
Data correspond to usage on the plateform after 2015. The current usage metrics is available 48-96 hours after online publication and is updated daily on week days.
Initial download of the metrics may take a while.