Fig. 9
Download original image
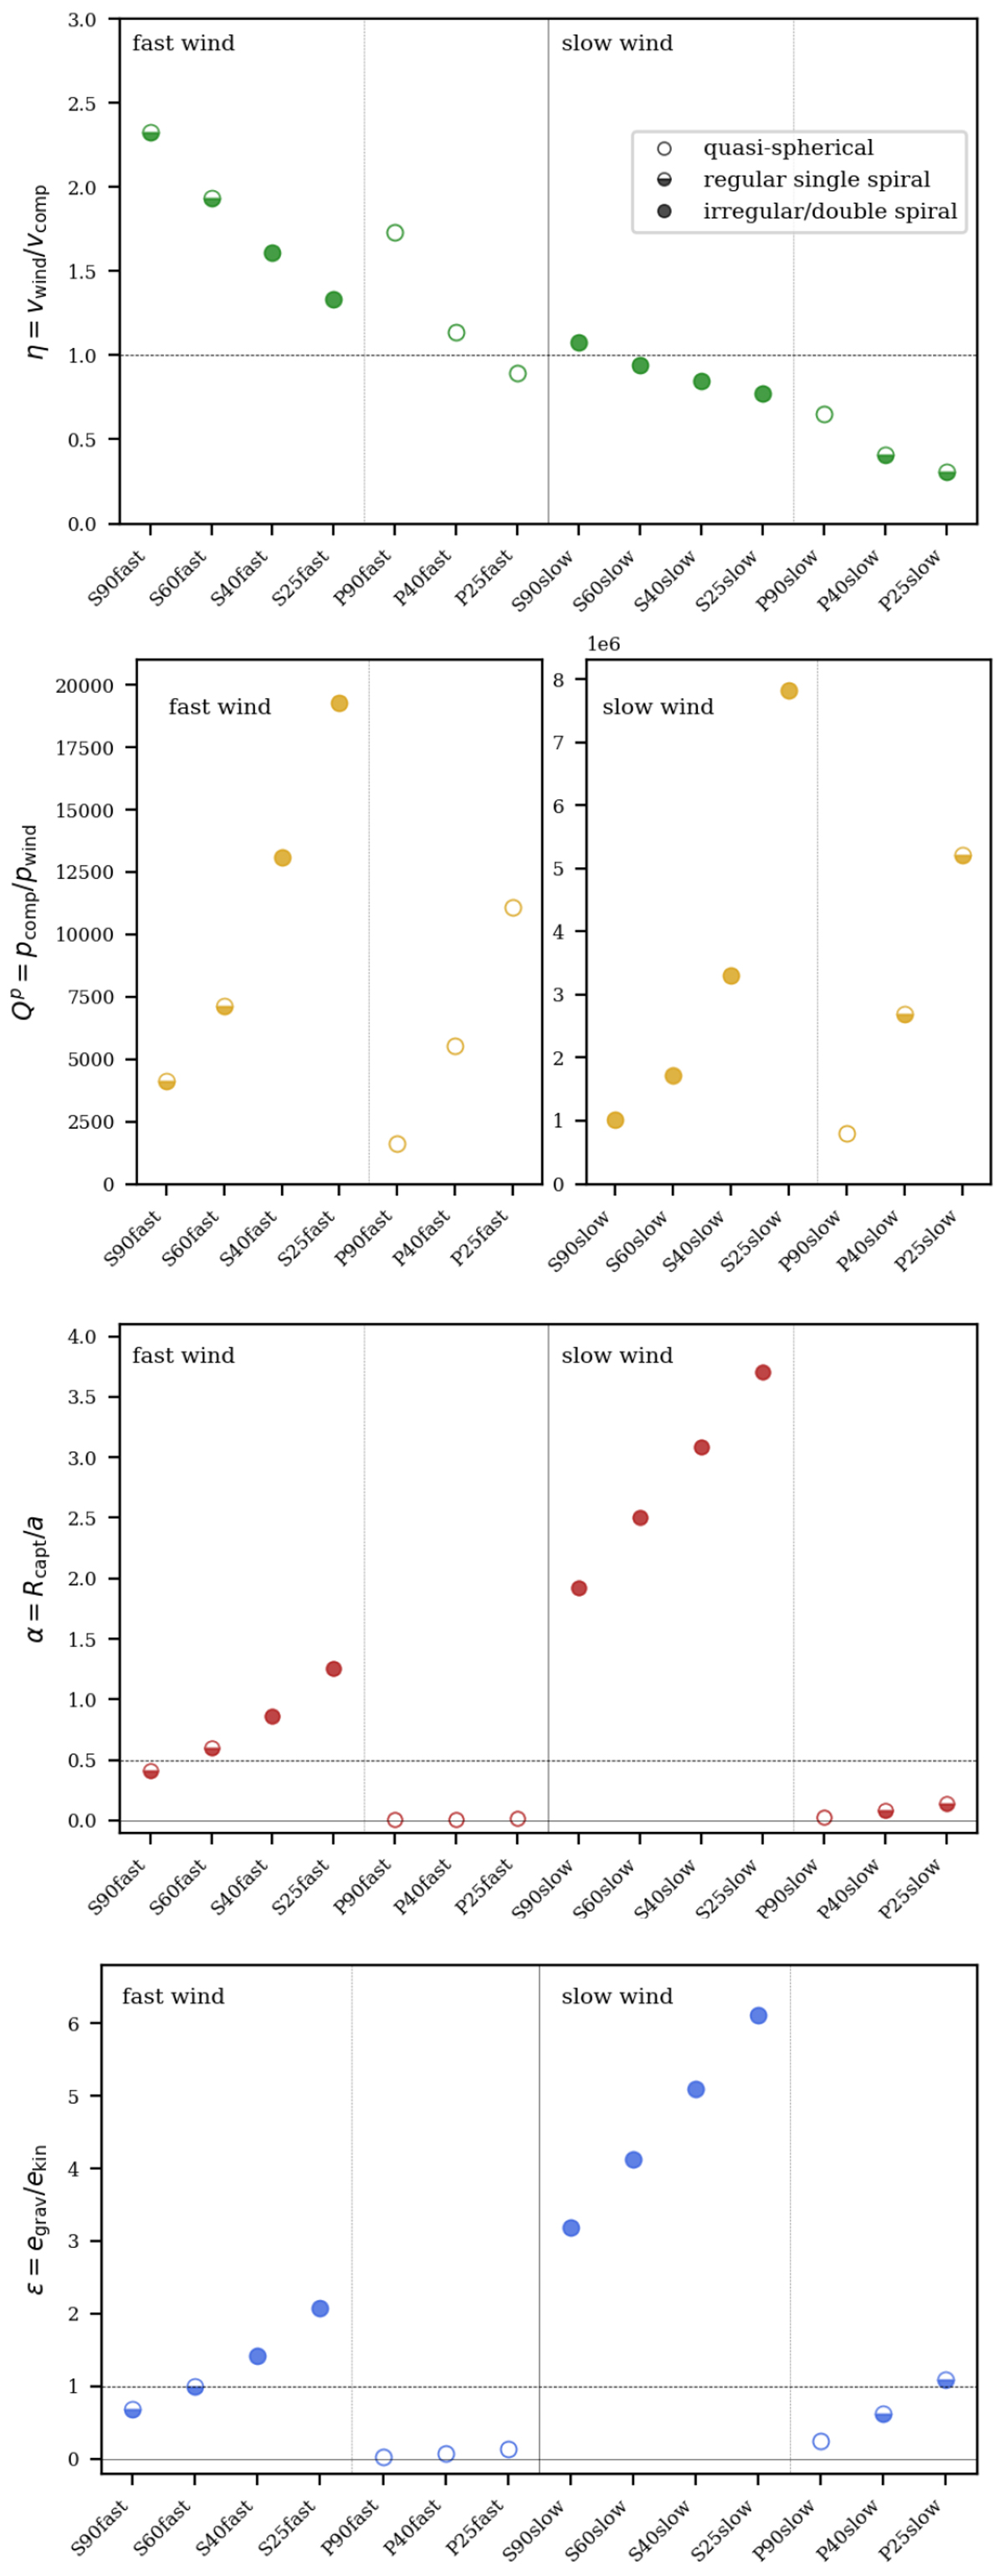
Resulting values of the different classification parameters. The different models are given on the horizontal axis in each panel: fast models (left) and slow models (right). The fillstyle of the symbols indicate the morphology found in the outflow of the model, as given by the legend in the top figure. For all but η, we expect more complex morphologies to correspond to higher values for the different classification parameters w.r.t. quasi-spherical morphologies, for η we expect lower values.
Current usage metrics show cumulative count of Article Views (full-text article views including HTML views, PDF and ePub downloads, according to the available data) and Abstracts Views on Vision4Press platform.
Data correspond to usage on the plateform after 2015. The current usage metrics is available 48-96 hours after online publication and is updated daily on week days.
Initial download of the metrics may take a while.