Fig. 8
Download original image
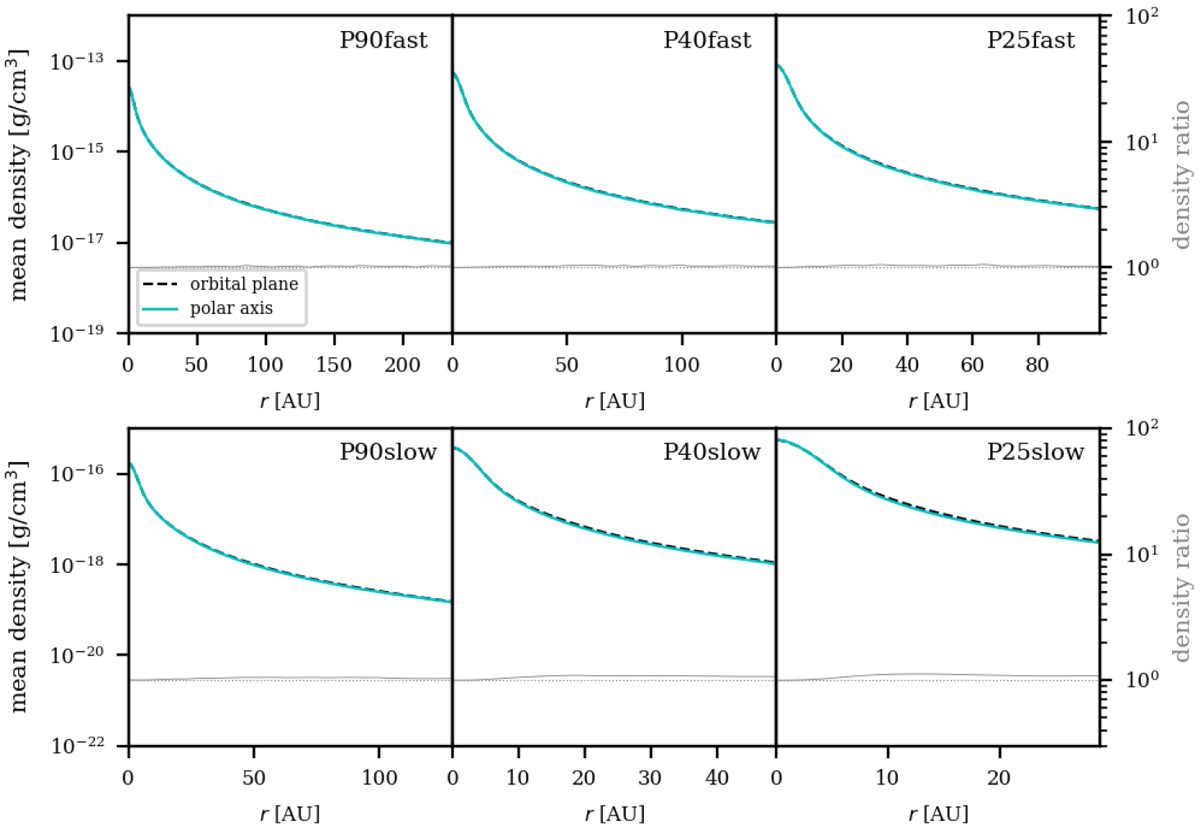
Radial structure profiles of the mean density of the planetary models around the polar axis ⟨ρpolar ⟩ (cyan, full lines) and in the orbital plane ⟨ρorb⟩ (black, dashed lines). The grey lines give ratio of the mean densities ⟨ρorb⟩∕⟨ρpolar⟩, corresponding to the y-axis on the right side of the plots. Top: fast wind models, bottom: slow wind models. From left to right according to decreasing binary separation.
Current usage metrics show cumulative count of Article Views (full-text article views including HTML views, PDF and ePub downloads, according to the available data) and Abstracts Views on Vision4Press platform.
Data correspond to usage on the plateform after 2015. The current usage metrics is available 48-96 hours after online publication and is updated daily on week days.
Initial download of the metrics may take a while.