Fig. B.2
Download original image
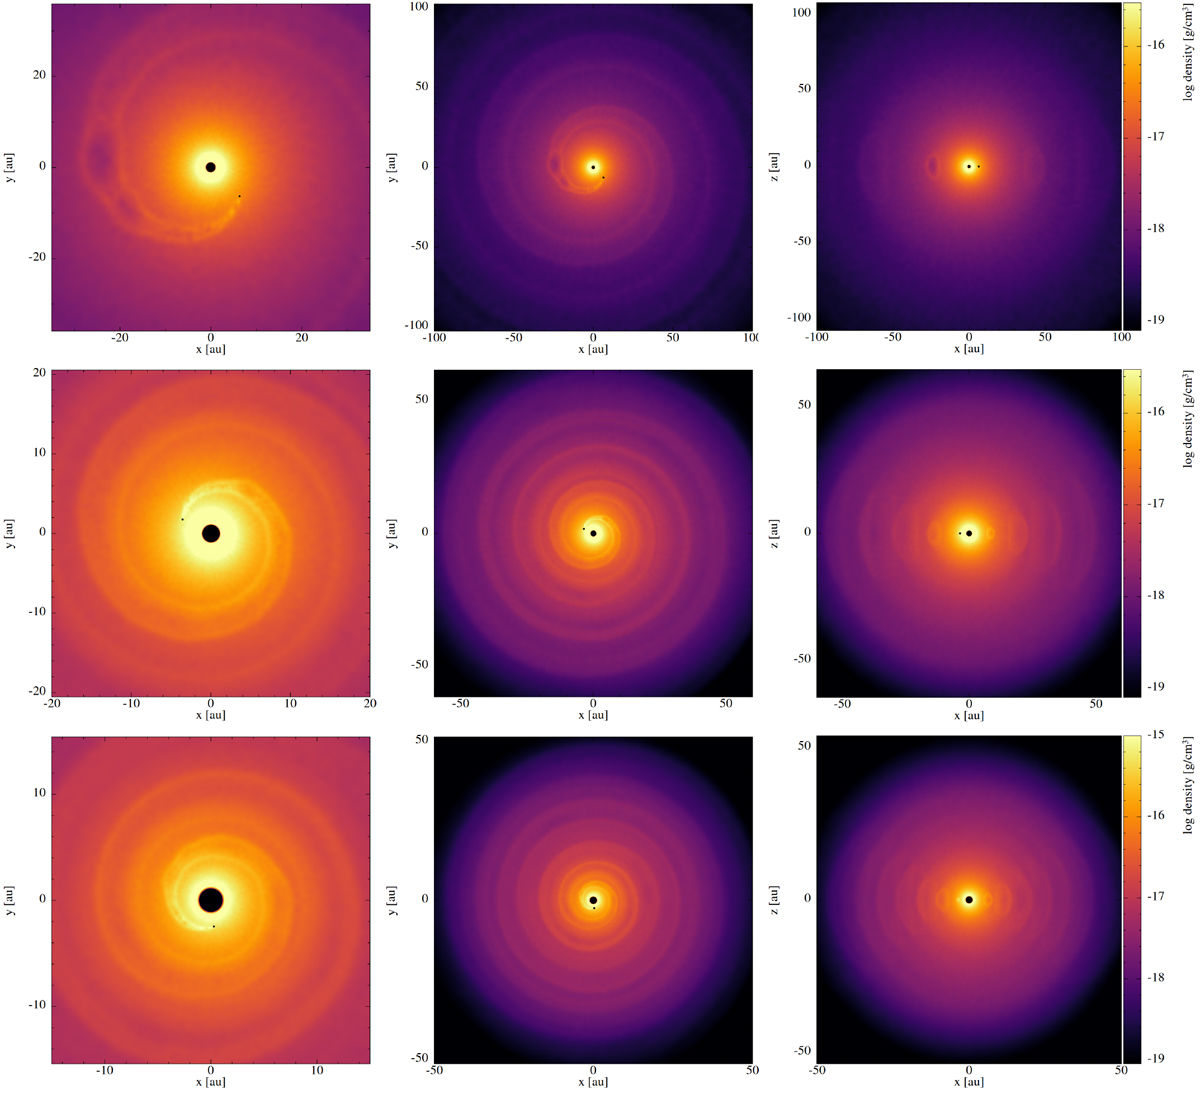
Density distribution of the orbital plane (left panels zoom-in of middle panels) and meridional plane (right panels). From top to bottom: models P90SLOW, P40SLOW and P25SLOW. Left and right black dots represent the AGB star and companion, respectively, not to scale. Snapshot taken after 5, 7 and 10 orbits, respectively, at which self-similarity is reached.
Current usage metrics show cumulative count of Article Views (full-text article views including HTML views, PDF and ePub downloads, according to the available data) and Abstracts Views on Vision4Press platform.
Data correspond to usage on the plateform after 2015. The current usage metrics is available 48-96 hours after online publication and is updated daily on week days.
Initial download of the metrics may take a while.