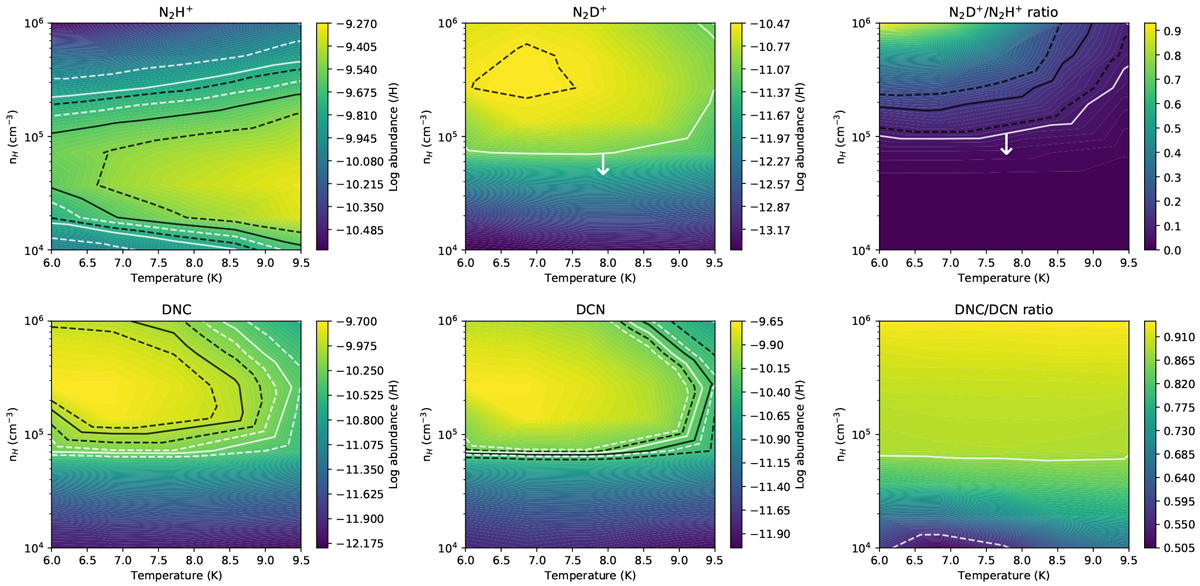
Fig. 4
Download original image
Grids of NAUTILUS models with varying temperature and hydrogen nuclei density. Each plot shows the contour levels of the N2H+ (top left), N2D+ (top middle), DNC (bottom left), and DCN (bottom middle) abundances; the N2H+ deuterium fraction (top right); and the DNC/DCN ratio (bottom right) at time t ≈ 106 yr. Additionally, we show the contours that correspond to the abundances derived from the N2H+, N2D+, DNC, and DCN column densities in TMC 1-C (black) and TMC 1-CP (white), their uncertainties (dashed lines), and the upper bound values if present (white arrows). The model does not reproduce our estimated DNC/DCN ratio towards TMC 1-C, and thus the black contours are missing from that panel.
Current usage metrics show cumulative count of Article Views (full-text article views including HTML views, PDF and ePub downloads, according to the available data) and Abstracts Views on Vision4Press platform.
Data correspond to usage on the plateform after 2015. The current usage metrics is available 48-96 hours after online publication and is updated daily on week days.
Initial download of the metrics may take a while.