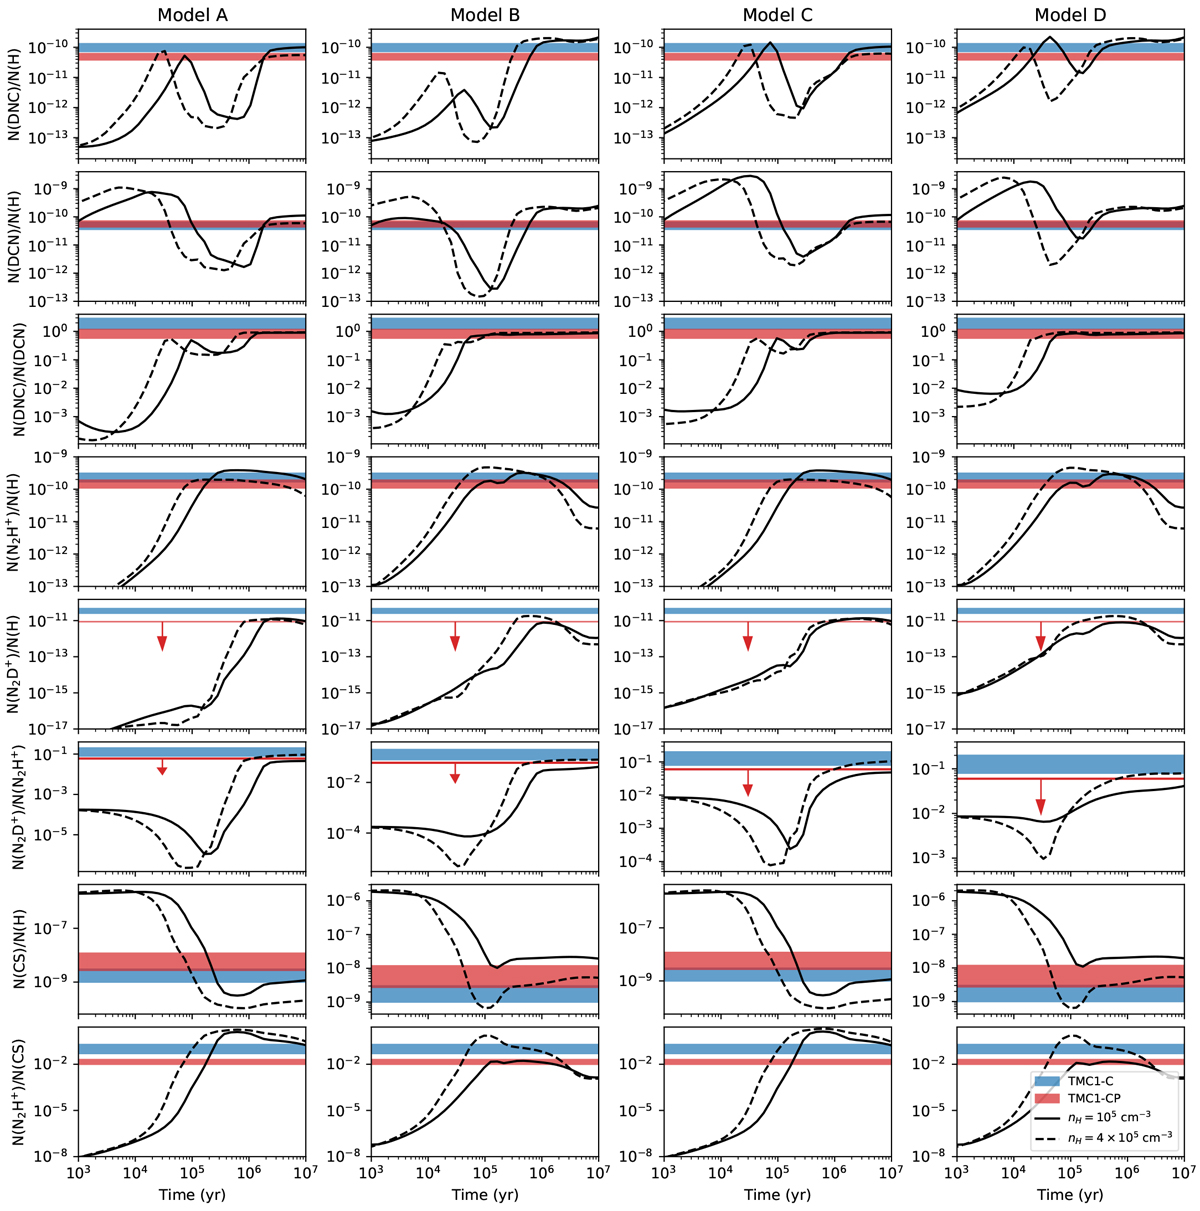
Fig. 3
Download original image
Abundances and abundance ratios of the different molecules, as predicted by the models described in Table 4. The predicted values are shown in solid (model with nH = 105 cm−3) and dashed lines (model with nH = 4 × 105 cm−3). The blue and red areas show the observed abundances in TMC 1-C and TMC 1-CP, respectively. The arrows indicate upper bound values.
Current usage metrics show cumulative count of Article Views (full-text article views including HTML views, PDF and ePub downloads, according to the available data) and Abstracts Views on Vision4Press platform.
Data correspond to usage on the plateform after 2015. The current usage metrics is available 48-96 hours after online publication and is updated daily on week days.
Initial download of the metrics may take a while.