Fig. 2
Download original image
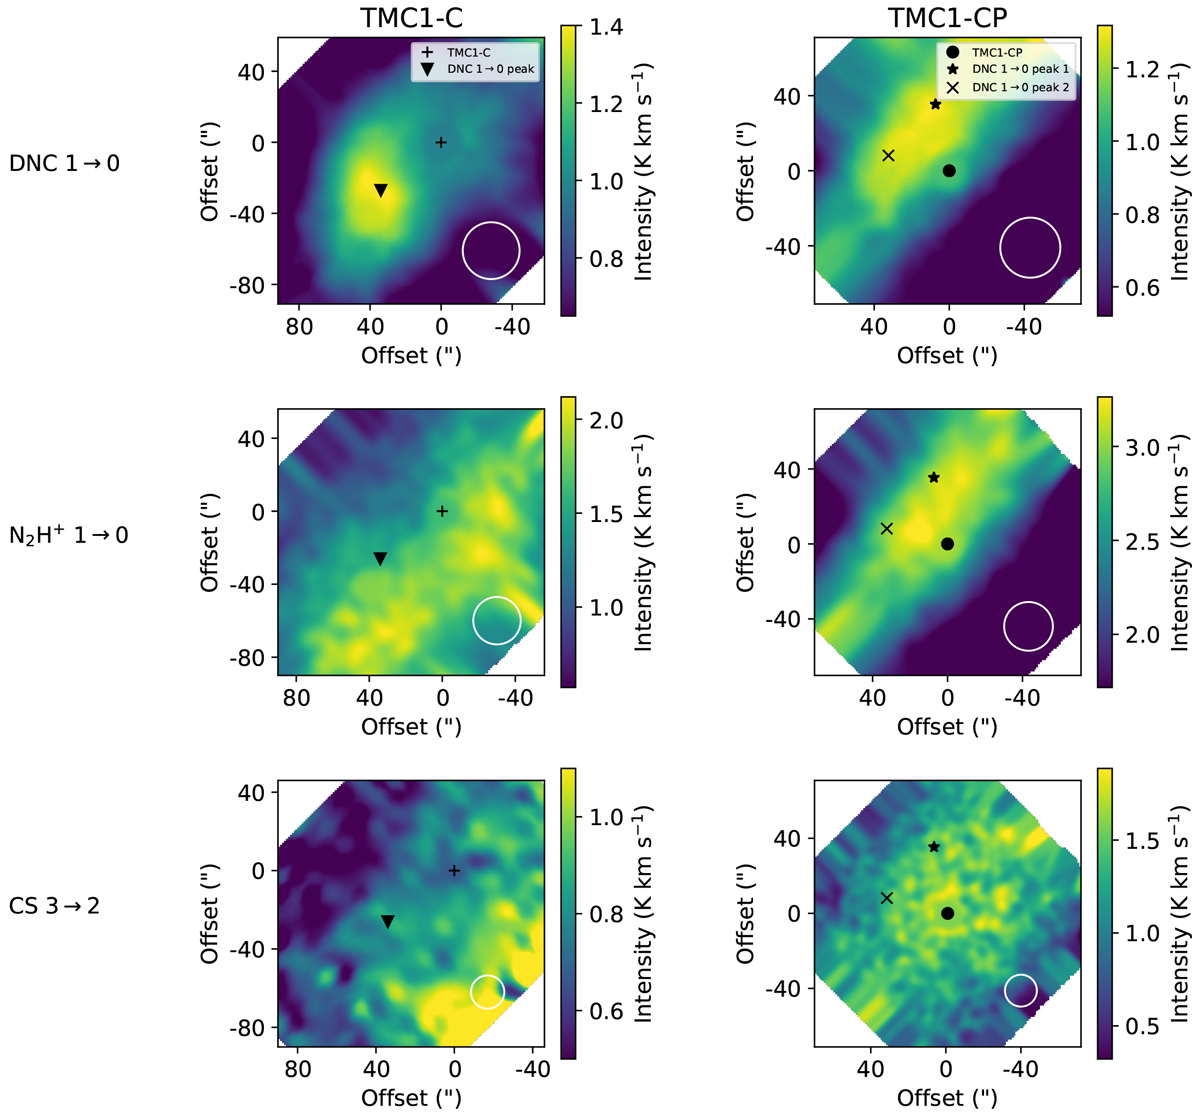
Velocity-integrated intensity maps of TMC 1-C (left) and TMC 1-CP (right) molecular emission of DNC 1 → 0, N2H+ 1 → 0, and CS 3 → 2. The integration was performed from 4 to 8 km s−1 when no hyperfine structure is present. Otherwise, the emission is integrated to cover all hyperfine components. Also shown are the selected positions from Table 2 and the beam sizes from Table 1 in each map.
Current usage metrics show cumulative count of Article Views (full-text article views including HTML views, PDF and ePub downloads, according to the available data) and Abstracts Views on Vision4Press platform.
Data correspond to usage on the plateform after 2015. The current usage metrics is available 48-96 hours after online publication and is updated daily on week days.
Initial download of the metrics may take a while.