Fig. 1
Download original image
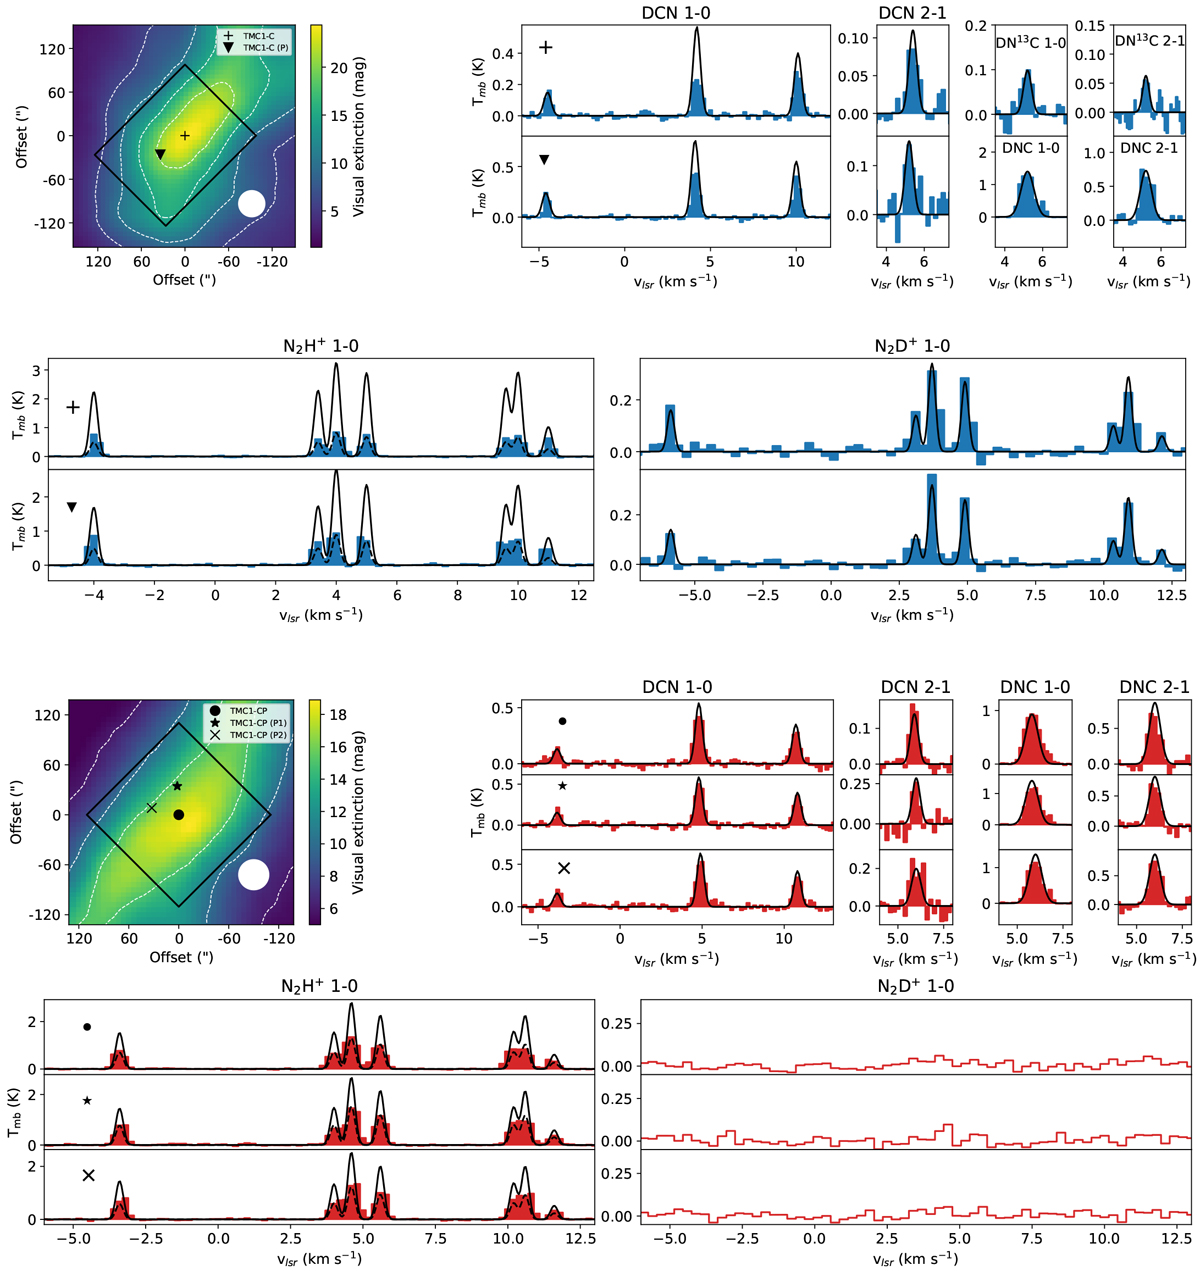
Top left and third row, left: visual extinction maps from Herschel data (Jason Kirk, priv. comm.) of the TMC 1-C and TMC 1-CP cores, respectively, with the areas mapped in the transitions presented in Table 1. Contour lines show levels of extinction of 6, 10, 15, and 20 mag. The blue and red spectra show the observed molecular lines in TMC 1-C and TMC 1-CP, respectively. The solid lines show synthetic spectra created with the model parameters present in Table 3.
Current usage metrics show cumulative count of Article Views (full-text article views including HTML views, PDF and ePub downloads, according to the available data) and Abstracts Views on Vision4Press platform.
Data correspond to usage on the plateform after 2015. The current usage metrics is available 48-96 hours after online publication and is updated daily on week days.
Initial download of the metrics may take a while.