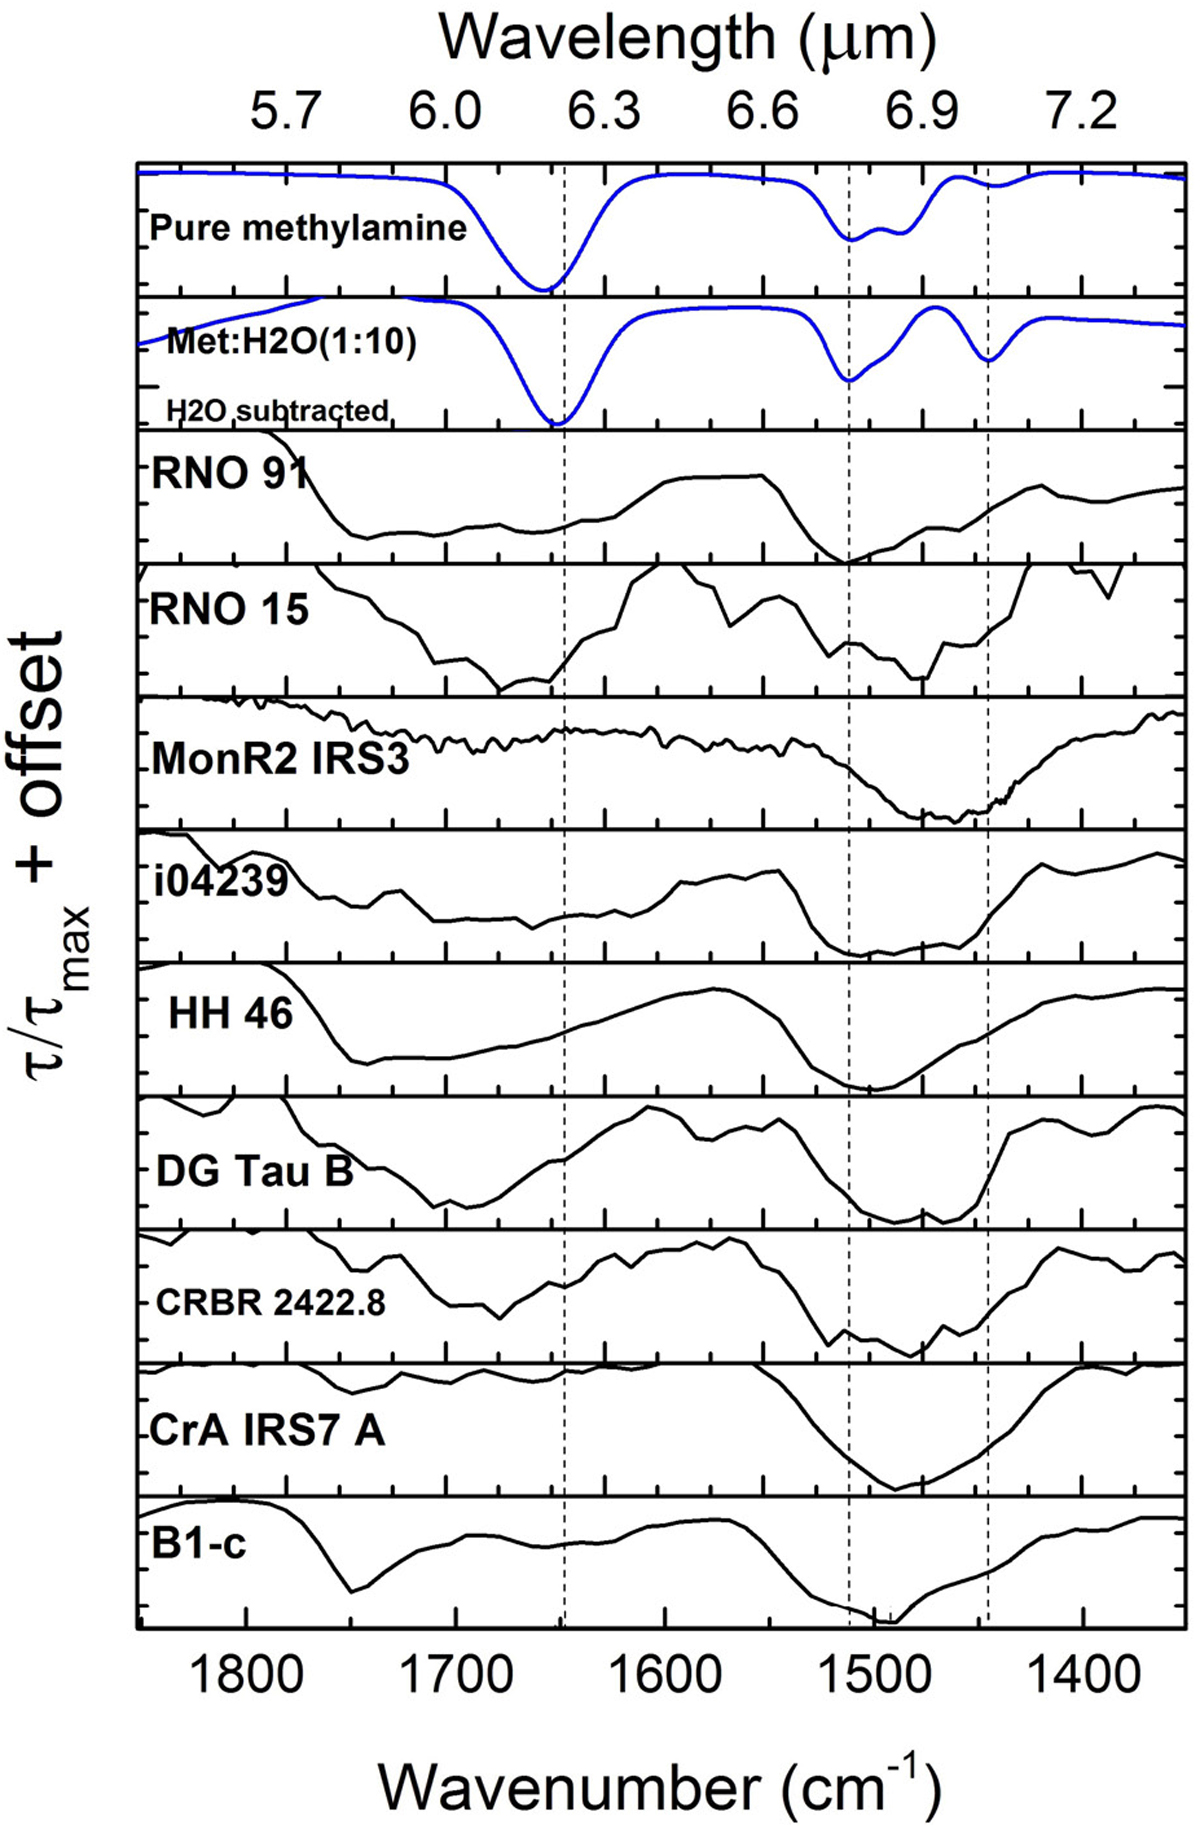
Fig. 9
Download original image
Comparison between laboratory spectra of methylamine-containing ices and some Spitzer/IRS spectra of YSOs (with H2O subtracted) in the 5.4–7.4 μm range (Boogert et al. 2008). Two top panels: spectra of pure methylamine ice at 15 K and the H2O subtracted CH3NH2:H2O(1:10) ice spectra at 15 K. The vertical dashed lines mark the peak positions of the bands in this mixture. The laboratory spectra are convolved with a Gaussian profile with FWHM corresponding to the Spitzer/IRS resolution (R = 100). Both the laboratory and YSO spectra are normalized with respect to the 1612.9 cm−1 (6.2 μm) feature for better visualization.
Current usage metrics show cumulative count of Article Views (full-text article views including HTML views, PDF and ePub downloads, according to the available data) and Abstracts Views on Vision4Press platform.
Data correspond to usage on the plateform after 2015. The current usage metrics is available 48-96 hours after online publication and is updated daily on week days.
Initial download of the metrics may take a while.