Fig. 8
Download original image
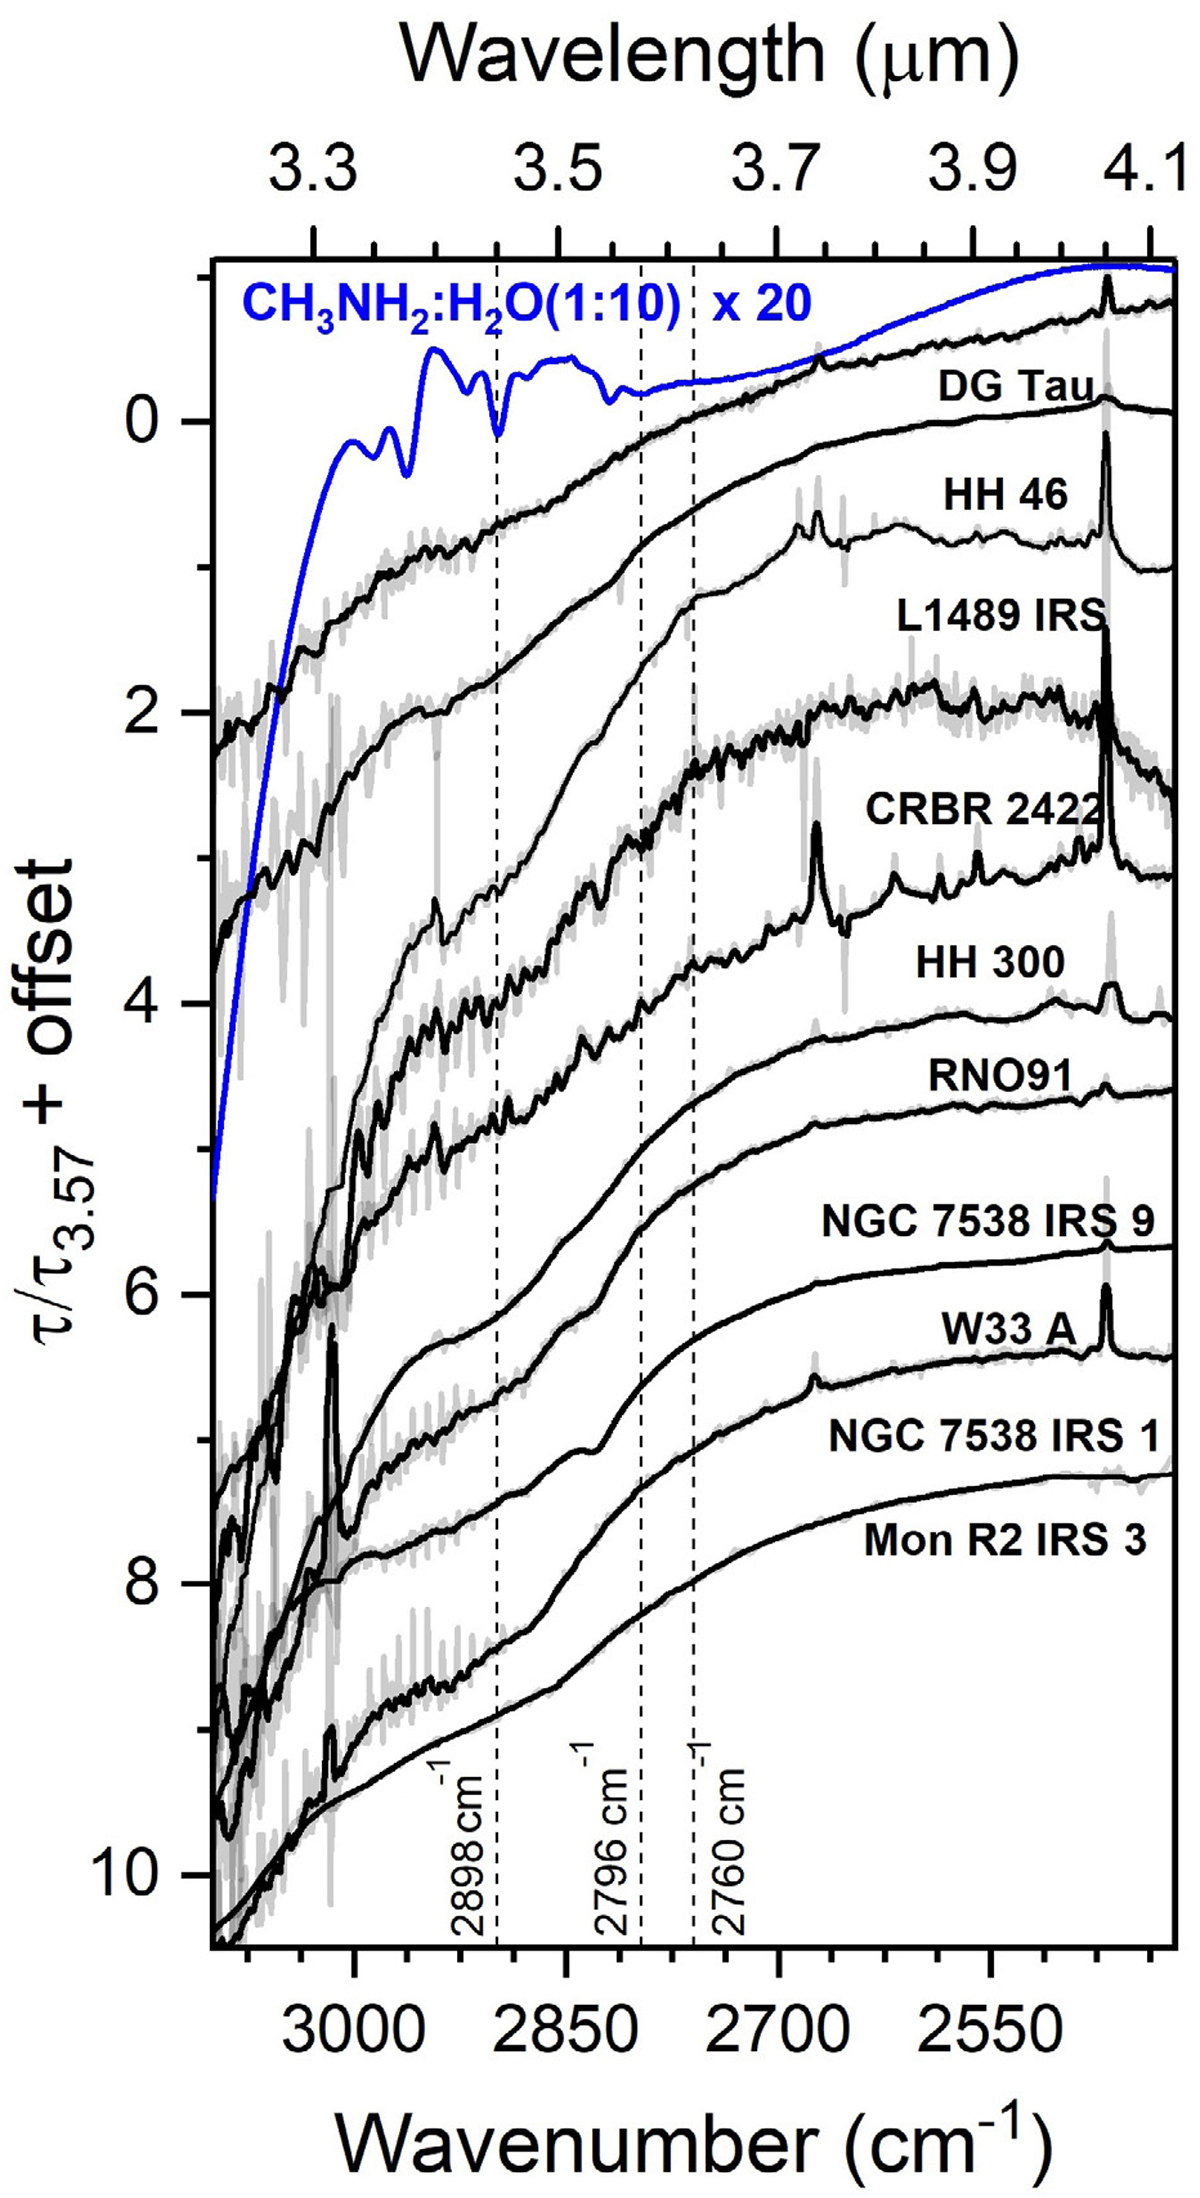
Comparison between the IR profile of YSOs and the absorption spectra of the CH3NH2:H2O(1:10) ice at 15 K (top blue curve). All the YSO spectra are normalized in relation to the optical depth at 2800 cm−1 (3.57 μm). The gray lines are the original spectra and the black lines are the smoothed spectra. The smoothing uses a 15-point boxcar, that corresponds to a window of 4–6 cm−1 in the analyzed spectra. The position of the methylamine bands at 2898, 2796, and the feature at 2760 cm−1 are marked with dashed lines.
Current usage metrics show cumulative count of Article Views (full-text article views including HTML views, PDF and ePub downloads, according to the available data) and Abstracts Views on Vision4Press platform.
Data correspond to usage on the plateform after 2015. The current usage metrics is available 48-96 hours after online publication and is updated daily on week days.
Initial download of the metrics may take a while.